Gantt charts: dependencies, critical path & how to build one
A timeline shows you when things happen. A Gantt chart shows you how they affect each other, through linked task dependencies, a calculated critical path, and live progress tracking. This guide goes deep on all three.
What is a Gantt chart?
A Gantt chart is a type of bar chart used in project management to represent a project schedule. Tasks sit on the vertical axis; time runs along the horizontal axis. The position and width of each horizontal bar reflect the start date, duration, and end date of that activity.
Because of this layout, a Gantt chart lets you see at a glance:
- Every activity that makes up the work-breakdown structure of a project;
- When each task begins and ends, and how long it is scheduled to last;
- Where and by how much tasks overlap;
- How tasks are linked to one another — their dependencies;
- The critical path of the overall project.
The last two points are what separate a Gantt chart from an ordinary timeline. A timeline can show when things happen; a Gantt chart shows how they affect each other.
Gantt chart history
Although they are everywhere in project planning today, Gantt charts were revolutionary when introduced. The chart is generally attributed to American engineer and management consultant Henry Gantt, who popularized it in Western countries around 1910–1915. What he actually did was refine an earlier version — the harmonogram — devised by Polish engineer Karol Adamiecki in 1896.
The earliest Gantt charts were drawn by hand and didn't show interdependencies, so they had to be redrawn from scratch every time a schedule changed. Since change is a constant on most projects, those early charts had limited shelf life. The arrival of computers and project-management software in the 1980s made Gantt charts far easier to create, update, and print.
By the late 1990s, with the internet and networked collaboration, Gantt charts became part of web-based groupware and one of the most widely used tools for project scheduling. Modern Gantt charts now show much more than bars and dates — interdependencies, the resources used for each task, who owns each task, and current status through percent-complete shading and a vertical "today" line. The rest of this guide covers each of those modern capabilities in turn.
The anatomy of a Gantt chart: how it works
A Gantt chart is built on two axes. The vertical axis lists every activity (task) and event (milestone) to be completed. The horizontal axis is the timescale of the project. Each task is drawn as a task bar whose left edge marks the start date, whose length marks the duration, and whose right edge marks the end date.
Layered on top of that grid are the elements that turn a static bar chart into a working schedule:
- Milestones — zero-duration markers for key dates (kickoffs, approvals, launches).
- Dependency links — connectors showing which tasks must wait on others (covered next).
- Percent-complete shading — a fill inside each bar showing progress against plan.
- A "today" line — a vertical marker that instantly shows what's on track, ahead, or slipping.
- Resource and owner labels — who is doing the work.
Task dependencies and the four relationship types
Dependencies are the heart of what makes a Gantt chart more than a timeline. A dependency is a rule that links two tasks so that a change to one automatically affects the other. Every task except the very first and very last has a predecessor and a successor, and the relationship between them takes one of four forms:
- Finish to Start (FS) — the most common. The successor can't begin until the predecessor finishes. Example: you can't paint the wall until the plaster has dried.
- Start to Start (SS) — the successor can't begin until the predecessor begins. Example: quality checks can't start until production starts, but the two then run in parallel.
- Start to Finish (SF) — the successor can't finish until the predecessor starts. Example: the outgoing on-call shift can't end until the incoming shift begins.
- Finish to Finish (FF) — the successor can't finish until the predecessor finishes. Example: testing can't be signed off until development is signed off.
Setting these relationships correctly is what lets a Gantt chart recalculate itself: move one task and every dependent task shifts with it. A good Gantt chart maker updates the whole schedule automatically when you drag a single bar.
The critical path
The critical path is the longest chain of dependent tasks that determines the shortest possible project duration. Any delay to a task on the critical path delays the entire project; tasks off it have slack and can slip without moving the finish date.
Identifying the critical path tells a project manager exactly where to focus: which tasks can't slip, where to add resources if the deadline tightens, and which delays are safe to absorb. Because the critical path depends entirely on how tasks are linked, it only emerges once dependencies are mapped — which is why it belongs to Gantt charts specifically rather than to timelines in general.
Learn more in our dedicated guide to the critical path method.
Resourcing and task ownership
Modern Gantt charts don't just answer when — they answer who and with what. Two capabilities make this possible:
- Resource estimation — before durations can be trusted, each task needs its resources identified: labor, materials, and equipment. Resourcing is what turns a wish-list of dates into a schedule you can actually staff.
- Task ownership — assigning an owner to each bar makes accountability visible on the chart itself. Anyone looking at the Gantt instantly sees who is responsible for what, and where one person is overloaded across parallel tasks.
Together, dependencies, the critical path, and resourcing are the three things a Gantt chart does that a plain timeline does not.
How to create a Gantt chart
Before you build the chart itself, four preparation steps set up the schedule:
- Create activities — break the overall work package into discrete tasks.
- Sequence activities — place tasks in order and set the relationship between each pair (the four dependency types above).
- Estimate resources — identify the labor, materials, and equipment each task needs.
- Estimate durations — with sequencing and resources settled, estimate the time between each task's start and end.
Once your schedule is ready, you can build the chart from a Gantt chart template, in standard office tools, or with a dedicated Gantt chart maker that automates creation and updates.
For step-by-step, tool-by-tool instructions (Excel, PowerPoint, Project, Google Sheets and more), see our Gantt chart how-to hub. If you're weighing Gantt charts against other timeline formats first, start with the broader guide to making a timeline.
Easy Gantt chart maker
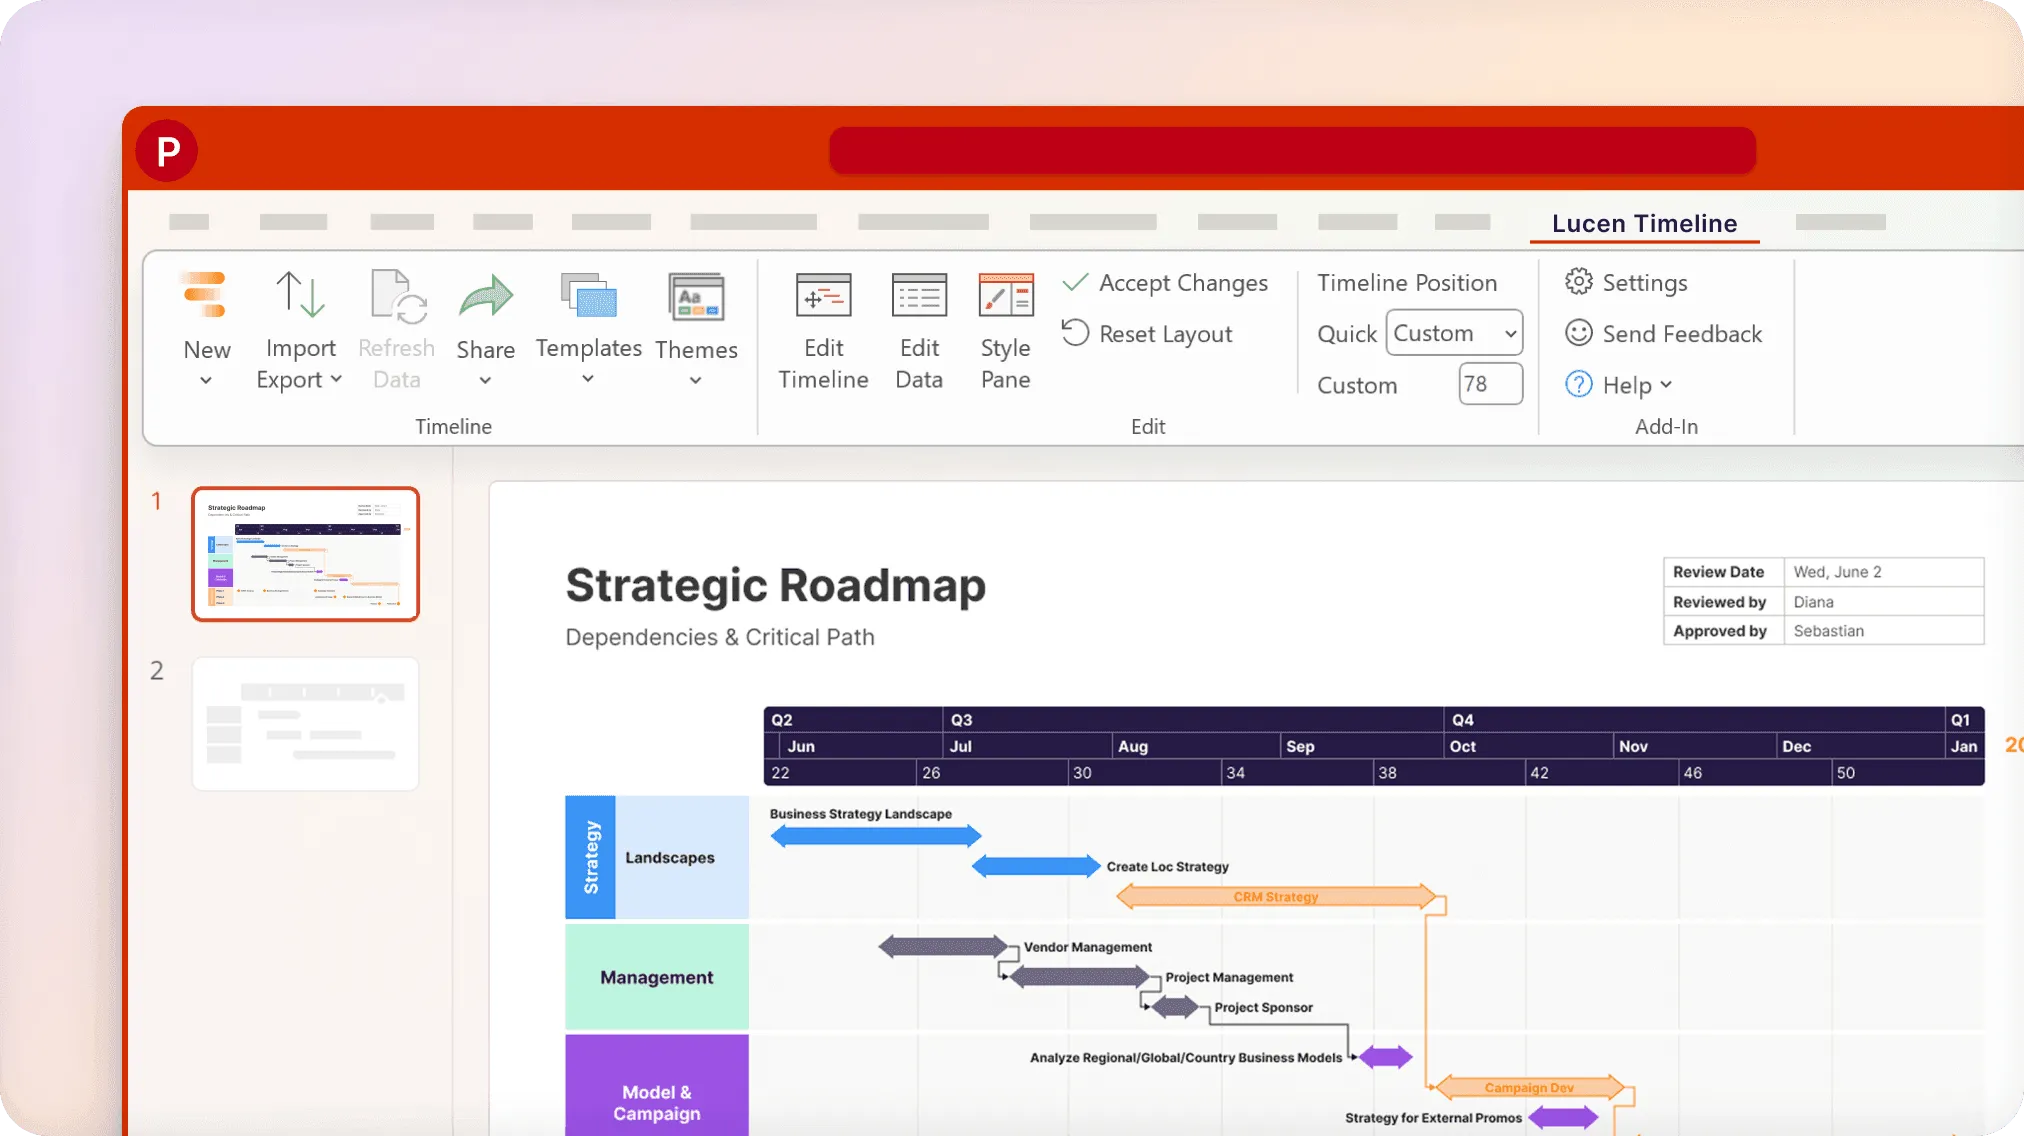
Transform complicated project data into stunning Gantt charts with the Lucen Timeline add-in for PowerPoint — dependencies, critical path, and live progress included.
What a Gantt chart example looks like
A useful Gantt example shows more than tasks on a calendar. Look for the elements that make it a working schedule rather than a static timeline:
- A task list with dependency links drawn between bars;
- A highlighted critical path running through the chart;
- Percent-complete shading inside each bar;
- A vertical "today" line showing status at a glance;
- Task owners labeled on or beside each bar.
See a range of these in our Gantt chart examples and templates gallery.
Gantt chart templates
Templates are the fastest way to start. For the general case for using templates — and how they save setup time — see the timeline templates overview. For ready-to-edit Gantt charts specifically, browse our free Gantt chart template collection, available in PowerPoint and Excel: download, plug in your tasks and dates, and you have a presentation-ready Gantt chart.
Gantt Chart software
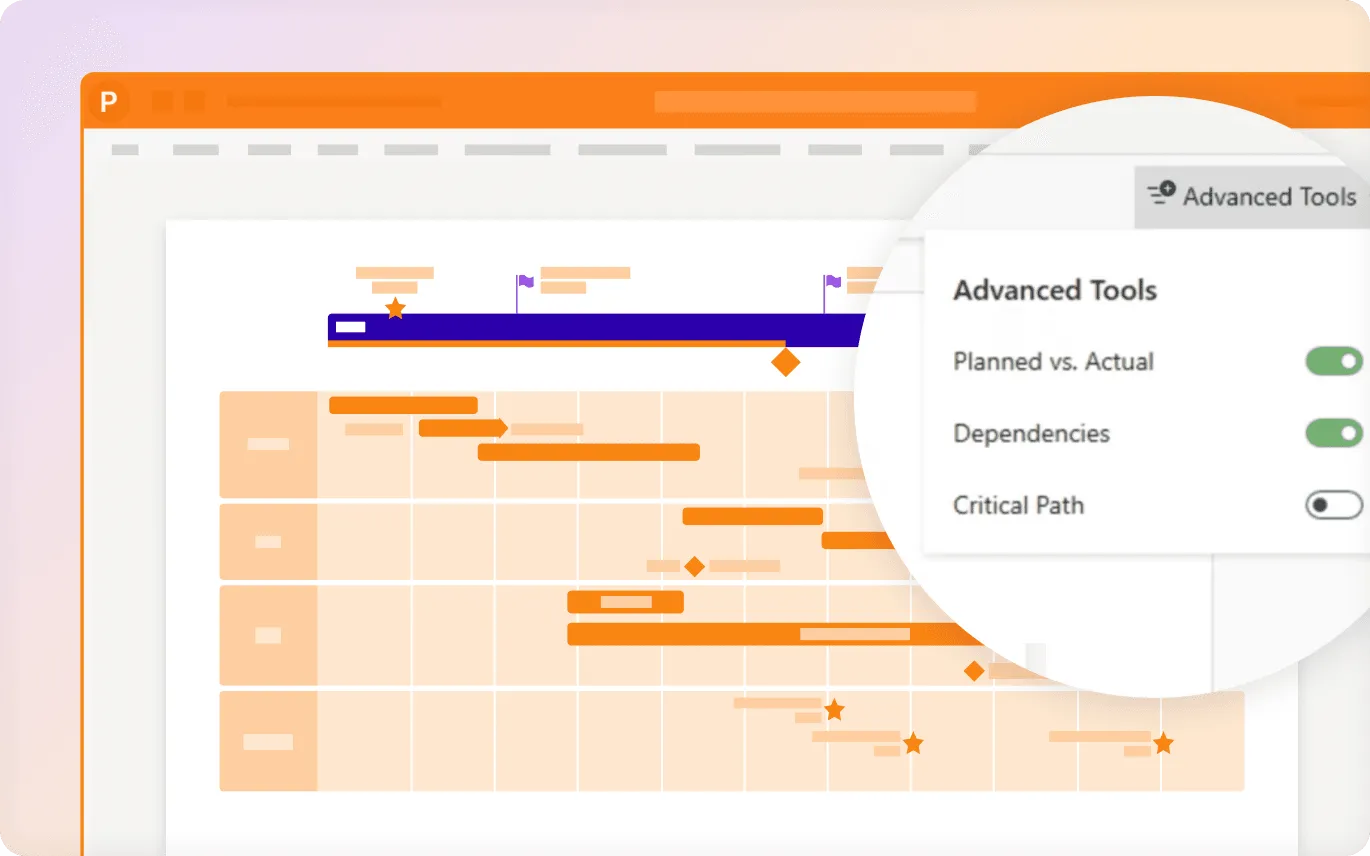
For how timeline software works in general — desktop vs. online, must-have features, and how to choose — see the timeline software section on our hub page. What sets Gantt software apart from a general timeline maker is the scheduling engine: it links task dependencies, calculates the critical path, and tracks planned vs. actual progress — not just the placement of bars on a date axis.
Lucen Timeline does this inside PowerPoint, as both a desktop and online tool. Import your data, drag to reschedule, and let dependencies recalculate automatically. The 14-day trial of the most advanced edition unlocks Planned vs. Actual tracking so you can visualize deviations from the original plan.
Frequently asked questions about Gantt charts
A Gantt chart is a bar chart that illustrates a project schedule by showing tasks and milestones against a timeframe. See live samples in our Gantt chart examples gallery.
A timeline is any chronological display of events and works across history, education, and planning. A Gantt chart is a timeline specialized for project scheduling: it adds task dependencies, a critical path, and resource assignments. Every Gantt chart is a timeline, but most timelines aren't Gantt charts. For the broader format, see our guide to timelines.
It uses two axes: tasks on the vertical axis, time on the horizontal. Each task is a bar whose position and width show its start, duration, and end. Dependency links between bars let the schedule recalculate when any task moves.
Showing project tasks against their timeframes, communicating schedules, coordinating effort, managing handoffs, and tracking progress.
See the Gantt chart how-to hub for tool-by-tool tutorials (Excel, PowerPoint, Project, Google Sheets, and more).
After American management consultant Henry Gantt, who popularized it around 1910–1915. He refined an earlier model — the harmonogram — created by Polish engineer Karol Adamiecki in 1896.