Overview
Clear, well-structured diagrams are at the heart of effective business communication. Whether you're mapping a workflow, presenting a project plan, or documenting a system, diagrams give everyone involved a shared visual reference, reducing ambiguity and keeping work moving in the right direction.
Without a visual tool to anchor conversations, teams often struggle with misaligned expectations, repeated back-and-forth, and processes that are hard to hand off or scale. A diagram turns complex information into something that can be understood at a glance, reviewed quickly, and updated as things change.
On this page, we cover everything you need to know about working with diagrams: what they are, which types to use for different situations, how to create them, and which tools make the process faster and more effective.
What is a diagram?
A diagram is a visual representation of information, showing how things relate, how processes flow, or how a system is structured. Rather than describing something in words, a diagram makes the structure visible using shapes, connectors, and labels to communicate what would otherwise take paragraphs to explain.
Diagrams are used across virtually every professional field, from engineering and software development to marketing and project management. What they all have in common is their ability to simplify complexity and make information accessible to a wider audience.
Utility and importance of diagrams in business and project management
Diagrams serve as a shared language between teams, departments, and stakeholders. A process diagram ensures everyone follows the same steps. An org chart clarifies who is responsible for what. A project plan diagram shows how tasks connect and what needs to happen before something else can begin.
Project managers in particular rely on diagrams to plan, communicate, and track work. Visual plans are easier to review in meetings, easier to share with executives, and easier to update when priorities shift. When a team can see the whole picture in one place, decisions get made faster and mistakes get caught earlier.
What are the benefits of using diagrams?
- Keeping all stakeholders, inside and outside the organization,aligned at every stage of a project
- Making complex processes, systems, and plans easy to understand at a glance
- Reducing back-and-forth in reviews and approvals by presenting information visually
- Identifying bottlenecks, gaps, and dependencies that are hard to spot in written descriptions
- Speeding up onboarding when new team members need to understand how something works
- Providing a reusable reference that can be updated as processes evolve
Types of diagrams
Diagrams come in many formats, each suited to a different kind of information. Choosing the right type for your situation is the first step to creating something useful. Here are the most common types used in business and project management contexts:
Flowchart
A flowchart maps a process step by step, from start to finish. Standardized shapes carry the meaning: rectangles for steps, diamonds for decisions, ovals for start and end points, all connected by arrows that show the direction of flow. When you need to document a procedure, troubleshoot a workflow, or explain how a system handles different conditions, this is the format to reach for.
Org chart
Who reports to whom, and how are the departments organized? An org chart answers those questions at a glance, laying out roles, reporting lines, and hierarchies across an organization or team. That clarity makes it essential for onboarding, restructuring planning, and helping external stakeholders figure out who to contact.
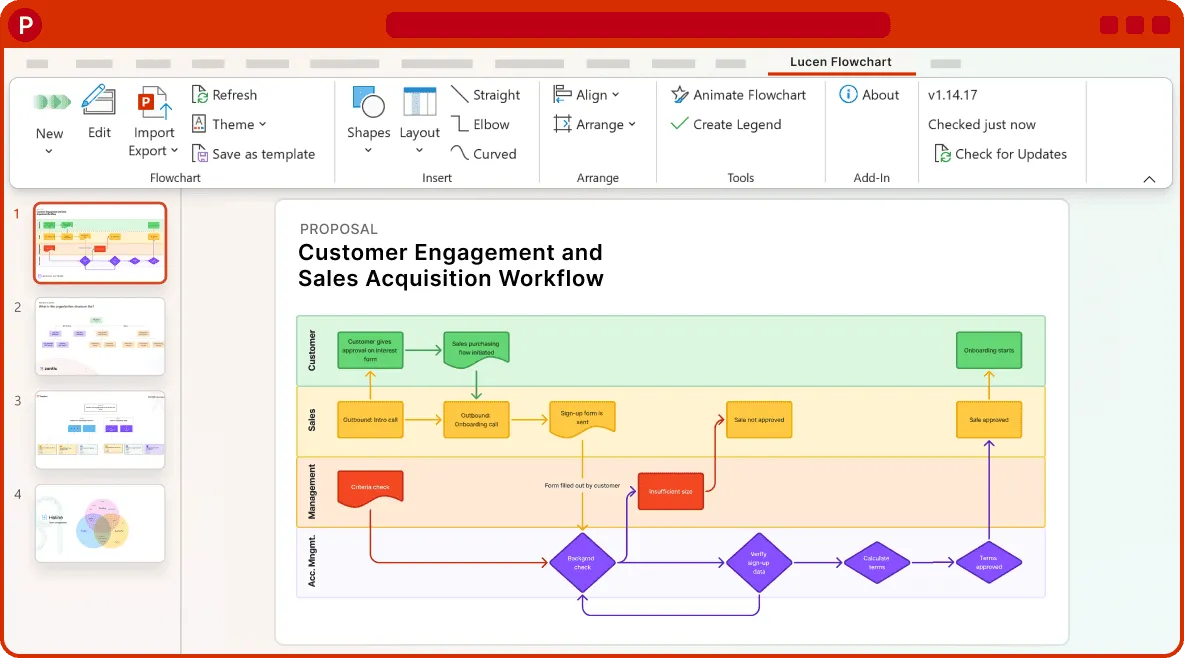
Swimlane diagram
Take a flowchart and divide it into lanes, one for each team, department, or role, and you have a swimlane diagram. The format captures not just what happens in a process but who owns each step, which is exactly what cross-functional workflows need when handoffs between teams are critical.
Gantt chart / project timeline
A Gantt chart plots project tasks against a timeline, with start dates, end dates, durations, and dependencies all visible in one view. Project managers and stakeholders rely on it to see the schedule at a glance and to spot where a delay might ripple downstream. For a detailed treatment of this diagram type, see our guide to project timelines.
Mind map
Mind maps work differently from the diagrams above. Rather than imposing a linear or hierarchical structure, they begin with a central idea and branch outward into related concepts, sub-topics, and details. That free-form quality is what makes them so well suited to brainstorming, organizing loose thoughts, and exploring connections between ideas before you commit to a structure.
How to create a diagram
Creating an effective diagram is as much about planning as it is about drawing. Here are the steps to follow when building a diagram for any purpose:
- Define the goal and scope. Before you start placing shapes, be clear about what the diagram needs to communicate and who will be reading it. A diagram for a technical team looks very different from one built for executive stakeholders.
- Choose the right diagram type. Use the section above as a guide. Match the format to the kind of information you're working with: a process gets a flowchart, a team structure gets an org chart, a project schedule gets a Gantt chart.
- Gather your content. List all the steps, roles, tasks, or components that need to appear in the diagram. Getting this down in a simple list before you start building saves time and prevents gaps.
- Lay out the structure. Place your elements in a logical order and connect them with arrows or lines that show relationships. Use consistent shapes, clean alignment, and clear labels throughout.
- Review and share. Get feedback from at least one other person who understands the subject matter. Check that the diagram is accurate, complete, and easy to follow for your intended audience.
- Keep it current. Diagrams quickly become outdated when processes change. Build in a habit of revisiting key diagrams when workflows, teams, or systems are updated.
Diagrams can be built manually in tools like Microsoft PowerPoint, Word, or Excel, though these can be time-consuming and limited when you need more advanced formatting or regular updates. Dedicated diagramming software automates much of the process, giving you more flexibility and making it faster to produce polished, presentation-ready visuals.
Diagram examples
The layout and structure of a diagram will vary depending on its type and purpose, but all effective diagrams share a few key characteristics regardless of format:
- A clear title that immediately tells the reader what they're looking at
- A logical flow or hierarchy that guides the eye from one element to the next
- Consistent use of shapes and connectors throughout
- Labels on every element; no unlabeled shapes or ambiguous arrows
- A legend when color coding or symbols are used
Below are a few examples of common diagram types to illustrate how these principles apply in practice.
Process flowchart example
A simple process flowchart for a content approval workflow might begin with a "Draft submitted" start point, pass through review steps for an editor and a legal reviewer, include a decision point for "Approved?", and branch to either "Publish" or "Return for revision." Each step is labeled with the action and the responsible role, and the decision point clearly shows both paths.
Swimlane diagram example
A swimlane diagram for the same approval process would divide the flow into three horizontal lanes: one for the content author, one for the editor, and one for the legal team, showing exactly which steps belong to which team and where handoffs occur. This format makes it immediately clear when work crosses from one department to another.
Org chart example
A basic org chart for a marketing department might show a VP of Marketing at the top, with three directors below: one for content, one for demand generation, and one for brand, each with their own team members branching downward. Even a simple three-level hierarchy becomes much easier to navigate visually than in a written description.
Templates for diagrams
Diagram templates are pre-built visual frameworks that you customize with your own content. Rather than starting from a blank canvas, you begin with a structure that already reflects best practices for that diagram type: shapes in the right places, connectors already drawn, labels ready to fill in.
Why use diagram templates?
Templates save significant setup time, particularly for diagram types you don't use every day. Instead of researching the correct notation for a swimlane or figuring out how to lay out an org chart from scratch, you start with a working example and adapt it to your situation.
Beyond speed, templates also enforce consistency. When everyone on a team uses the same base template for a given diagram type, the outputs look and feel the same: making them easier to read, compare, and present together. Templates can also be saved and reused across projects, building up a library of organizational assets over time.
Browse our free diagram template collection to get started. Get Lucen Flowchart, download your preferred template, add your content, and have a presentation-ready diagram in minutes.
Diagram creator tools
What is diagram software?
Diagram software is any tool that helps you create, format, and share diagrams more efficiently than you could with general-purpose office applications. Most dedicated diagramming tools offer a library of pre-built shapes and connectors, drag-and-drop positioning, automatic alignment, and export options that make the process significantly faster.
More advanced tools also support data import, so you can generate diagrams automatically from existing spreadsheets or project data rather than building them by hand. Features like real-time collaboration, version history, and direct integration with presentation tools make it easier to keep diagrams current and share them across teams.
Desktop vs. online diagram software
Desktop diagram software is installed locally on your machine and typically operates as a single-user tool. It works well for individuals who need to create diagrams independently and don't require real-time collaboration. Because it runs offline, it can also be a better fit for teams working with sensitive data that shouldn't leave the organization's network.
Online diagram software is designed around sharing and collaboration. Multiple team members can review and edit a diagram simultaneously, and sharing is as simple as sending a link. For most modern project teams where stakeholders are distributed or remote, cloud-based tools offer a more practical workflow.
Must-have features of diagram software
- Customizable templates that can be saved and reused across projects
- Intuitive drag-and-drop interface that requires no design experience
- A comprehensive library of shapes, connectors, and icons
- Export options including PowerPoint, PDF, PNG, and SVG
- Integration with project management and productivity tools
- Easy sharing with stakeholders who don't have a license
- Support for collaboration and review workflows
What is the best diagram software?
The best diagramming tool for your team depends on how you work, where you present, and who needs to access your diagrams. For most business professionals and project managers, the most important factors are ease of use, visual quality, and how easily diagrams can be incorporated into existing presentations and reports.
If your team lives in Microsoft PowerPoint for internal reviews, stakeholder updates, or executive presentations, a diagram tool that works natively inside PowerPoint offers a significant advantage. It eliminates the need to export, convert, or reformat diagrams every time something changes. Lucen Flowchart is built specifically for this workflow, letting you create and update professional diagrams directly inside PowerPoint without switching applications.
For a broader look at the options available, see our roundup of the best diagram maker tools.
Tips on maintaining accurate diagrams
Keeping diagrams up to date
One of the most common problems with diagrams in a business setting is that they become outdated almost as soon as they're published. Processes change, teams restructure, systems evolve and diagrams that no longer reflect reality can cause more confusion than no diagram at all.
The best way to keep diagrams accurate is to treat them as living documents rather than finished deliverables. Assign ownership to a specific person or team, set a regular review cadence, and choose tools that make updates quick enough that people actually do them. If updating a diagram takes 30 minutes of reformatting, it won't get done. If it takes two minutes of dragging and relabeling, it will.
Sharing diagrams effectively
Before sharing a diagram, consider your audience. A detailed process flowchart with decision branches and technical annotations is appropriate for the team implementing the process, but overwhelming for an executive who needs a high-level view. Having both a detailed version and a simplified summary version of important diagrams is worth the extra time.
For presentations, export diagrams directly to PowerPoint so they can be incorporated cleanly into slides without losing quality. For ongoing team reference, embed diagrams in shared documentation or wikis where they can be found and updated in context. For stakeholder reviews, cloud-based tools that allow commenting directly on the diagram save considerable back-and-forth over email.
Frequent questions about diagrams
In project management, a diagram is a visual tool used to plan, communicate, and track work. The most common types are Gantt charts (which show tasks against a timeline), flowcharts (which map processes and decision points), and swimlane diagrams (which show which team is responsible for each step in a workflow). Project managers use diagrams to give stakeholders a clear picture of scope, schedule, and status without requiring them to read through detailed documentation.
The most commonly used diagram types in business and project management contexts are flowcharts, org charts, swimlane diagrams, Gantt charts, mind maps, network diagrams, and entity relationship diagrams. Each serves a different purpose: flowcharts document processes, org charts show team structure, swimlane diagrams assign responsibility, and Gantt charts visualize project schedules. See the Types of diagrams section above for a description of each.
Lucen Software offers a free collection of diagram templates that can be downloaded and customized directly in Microsoft PowerPoint. Templates are available for a range of diagram types including flowcharts, swimlanes, and org charts. Browse and download from the template gallery; simply open the template, replace the placeholder content with your own, and your diagram is ready to present.
A flowchart is a specific type of diagram. All flowcharts are diagrams, but not all diagrams are flowcharts. Diagrams is a broad term that covers any visual representation of information: org charts, Gantt charts, mind maps, and network diagrams are all types of diagrams. A flowchart specifically maps a process or workflow, using a defined set of shapes (rectangles, diamonds, ovals) to show steps, decisions, and outcomes in sequence.
The best diagramming software depends on your team's workflow and where your diagrams end up being used. For professionals who present in Microsoft PowerPoint, Lucen Flowchart offers the advantage of building diagrams natively inside PowerPoint; no exporting or converting required. It is available as both a desktop add-in and an online tool, and produces presentation-ready visuals with a minimal learning curve. For a broader comparison of diagramming tools, see our guide to the best diagram maker software.