


Business Process Mapping in Microsoft Office: How Operations Teams Keep Process Maps Current in PowerPoint
Map SOPs, handoffs and approval workflows as native, editable PowerPoint shapes, and update them on the slide when the process changes.

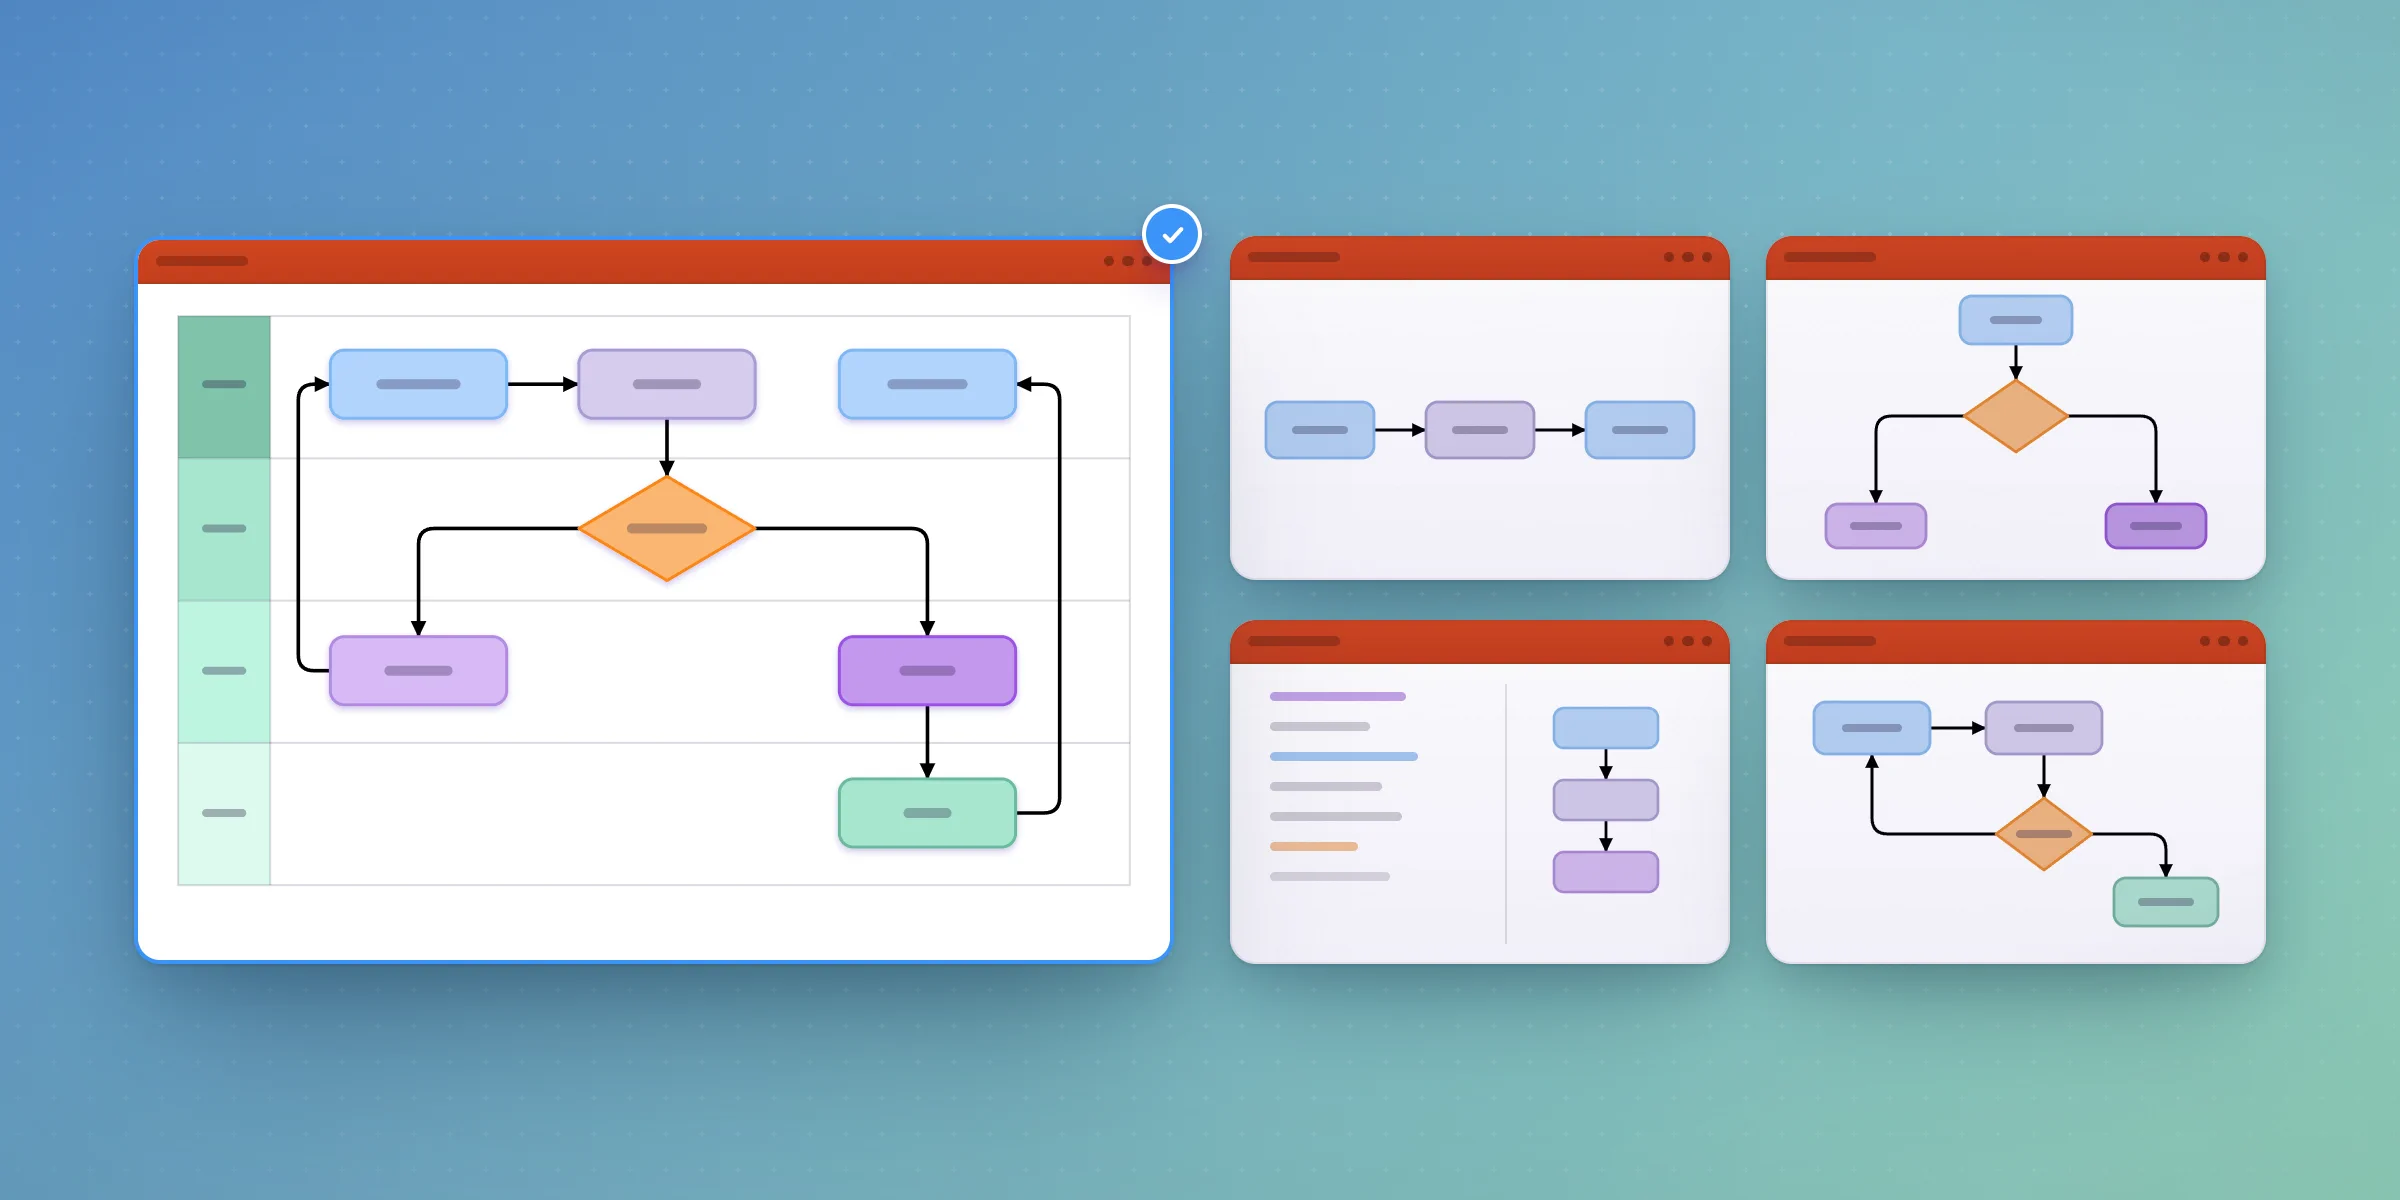
If your process maps get reviewed and presented in PowerPoint, the most practical way to map business processes in Microsoft Office is to build them on the slide. Lucen Flowchart, a PowerPoint add-in, turns a plain-language description into process maps, swimlane diagrams and decision trees made of native, editable shapes, so the SOP you present stays easy to update.
What are your options for process mapping in Microsoft Office?
- SmartArt: good for short, linear steps. It falls short on anything else, because its fixed layouts have no free-form connectors or decision logic.
- PowerPoint shapes drawn by hand: full control over the layout, but slow to build, and every change means realigning boxes and connectors.
- Excel: good for step lists and RACI tables, but leaders get a table instead of a map they can follow.
- Visio: good for detailed diagrams and formal notation. It's a separate app, so diagrams reach the deck as an export or an embed.
- Lucen Flowchart: built for process maps that get presented and updated in PowerPoint. It runs in PowerPoint for Windows only and isn't built for formal notation standards.
For more on what Microsoft 365 covers without an add-in, see Microsoft 365 for Gantt charts, hours and flowcharts. If your team already uses Visio, Lucen Flowchart vs Microsoft Visio compares the two side by side.
Why do process maps go stale?
A process map usually got built once, for an audit, an onboarding push or a leadership review. Then a handoff moved or an approval step was added, and the map stayed as it was because updating it meant redrawing half the slide. People kept following a version that no longer matched how the work actually happened.
In Lucen Software's April 2025 research with 308 diagramming users, building from scratch was the biggest pain, and manual updating came second, cited by 41% of people who use a dedicated diagramming tool and 60% of people who don't. A stale process map is a wrong process map, and if updating it means rebuilding it, it won't get updated.
How do you map a business process in PowerPoint with Lucen Flowchart?
- Describe the process in plain language. For example: "Purchase request: an employee submits a request, their manager approves anything under $5,000, finance approves anything above $5,000, procurement places the order and receiving confirms delivery."
- Lucen AI drafts the flowchart on your slide as native PowerPoint shapes, with a decision point for each approval.
- Add swimlanes for each role so ownership and handoffs are visible.
- Edit any step directly on the slide. Auto layout realigns the shapes and reroutes the connectors while keeping each step in its lane.
- Start from a template or apply your deck's theme so maps from different teams look consistent.
- Present from the same slide, and update it there when the process changes.
You can also skip the prompt and build from a template or your own shapes. Either way, the result is ordinary PowerPoint content that anyone with the deck can edit.
Which operations workflows does it fit?
Lucen Flowchart suits process maps that have to be shared, reviewed and kept current, for example:
- SOPs and work instructions (see our guide to the best software for documenting SOPs in Microsoft 365)
- Handoffs between teams, shifts or sites
- Employee and customer onboarding workflows
- Approval and escalation paths
- Current-state and future-state maps for improvement projects
In manufacturing, process and quality visuals change as often as the line does. A maintenance planner at a textile manufacturer described it plainly in our 2025 research: "Things are always changing at the plant. I need to be able to make changes quickly." Keeping the process map on a slide you can edit in place makes that realistic.
In healthcare operations, the same approach helps make clinical and operational workflows, patient handoffs and transformation work clear to the leaders who review them in PowerPoint.
Can you use it for Six Sigma and process-improvement maps?
Yes, for the cross-functional and swimlane process maps that improvement projects rely on, including current-state and future-state versions you can put side by side in the deck. Lucen Flowchart isn't designed for formal notation standards and doesn't link diagrams to data, so if your program requires a specific notation or data-driven diagrams, pair it with a specialized tool and use Lucen Flowchart for the maps you present. Our roundup of the best flowchart diagram software for PowerPoint users covers the other options.
What does everyone need to open and edit the map?
The person building the map signs in with a Lucen account and uses PowerPoint 2016 or later on Windows, including Microsoft 365. Everyone else only needs PowerPoint. The shapes are native, so reviewers can open and edit the map without the add-in or a Lucen account, and the file works with PowerPoint's own co-authoring.
Map your next SOP on the slide you'll present it from
Download Lucen Flowchart and start free. Describe your first process to Lucen AI and update it on the same slide when the process changes.
Frequently asked questions
A process map shows the steps and decisions in a process. A swimlane diagram is a process map split into lanes by team or role, which also shows who owns each step and where handoffs happen. For tools that build them, see Top 10 swimlane software for visual project management.
Yes. Start from templates on the Plus plan, and the shapes follow your presentation theme by default, so maps built by different people match the deck they sit in.
Not yet. You build maps in PowerPoint for Windows, and colleagues on Mac can open and edit the finished slides.
Yes. The Free plan lets you go from a process description to a shareable diagram with Lucen AI. Plus costs $9 per user per month on an annual license and adds unlimited diagrams, swimlanes, templates, and Lucen AI that turns flowchart images into editable diagrams, so a photo of an old paper SOP can become an editable map.
Process maps and flowcharts in PowerPoint: guides and how-tos

Subscribe to our blog
Get all the tips, tricks and inspiration you need to create professional looking timelines, straight to your inbox.