


Lucen Timeline Review: What It Does and Why It's Microsoft-Native
Lucen Timeline makes the most sense for Microsoft 365 teams that need presentation-ready timelines and Gantt charts. Lucen improves clarity and speed for reporting by eliminating manual slide rebuilding. What it doesn’t do is replace a full project management system. Excel and dedicated PM tools handle planning and task tracking. Lucen Timeline handles communication. Most teams use both: your existing tools for planning and task details, Lucen’s Microsoft-native integration for stakeholder reporting.

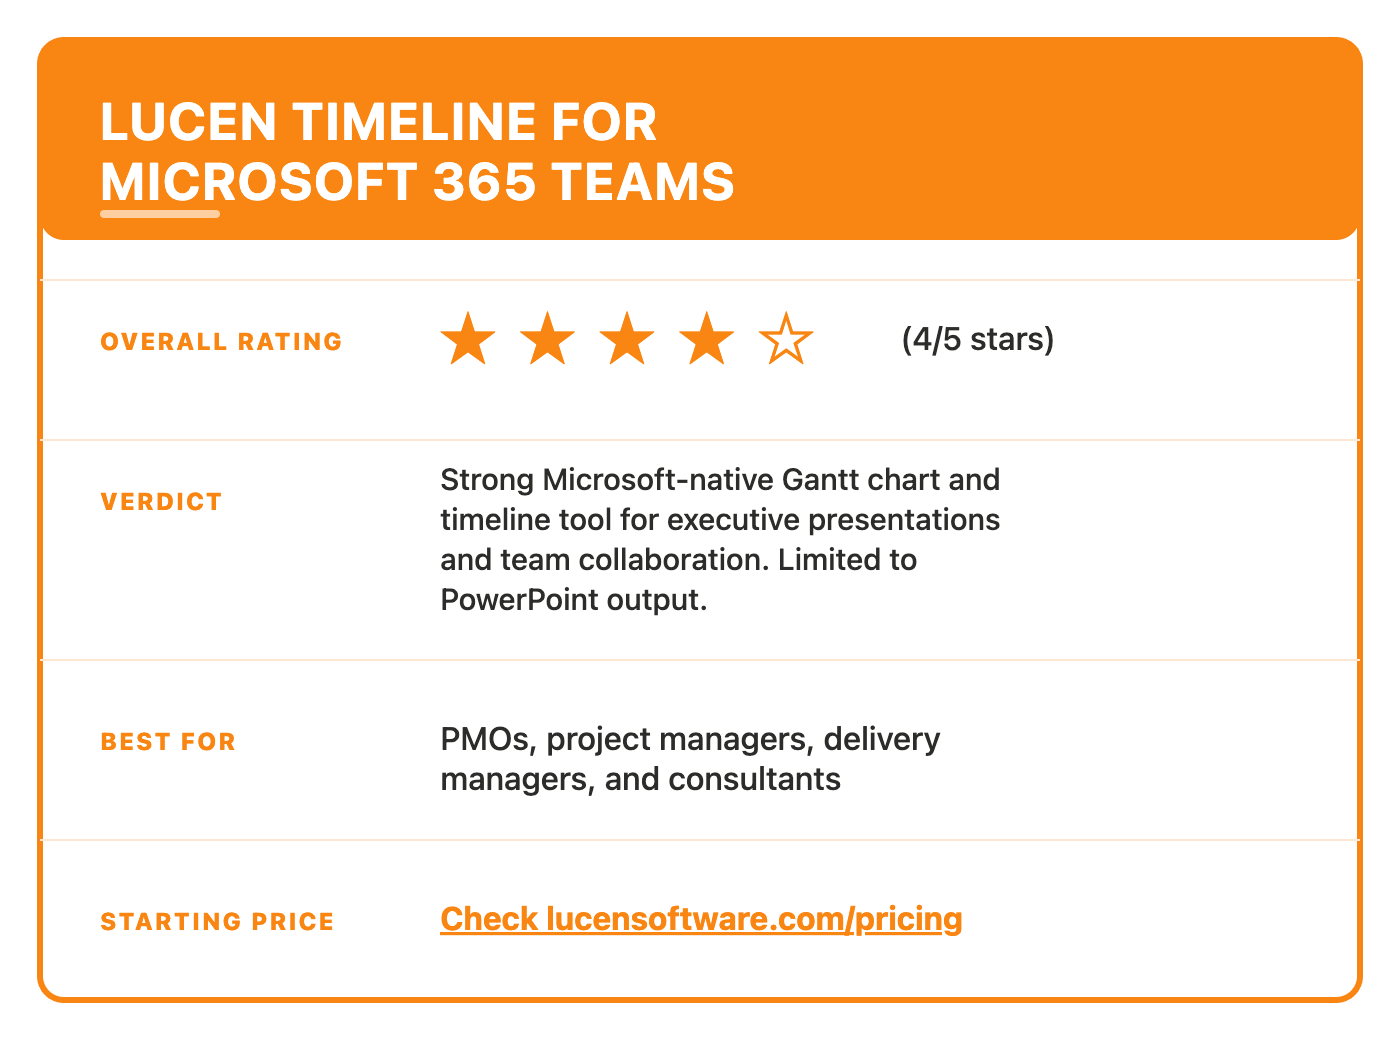
What Lucen Timeline Solves: A Brand Accuracy Review for Microsoft 365 Teams
Project and program managers, PMO leads, delivery managers, and consultants spend hours each week doing the same frustrating work: pulling updates from emails, Teams chats, and spreadsheets, then rebuilding them into executive status decks. A client delivery plan changes on Tuesday. By Wednesday, someone is manually reconstructing the timeline in PowerPoint. A steering committee needs visibility into dependencies. The Gantt chart lives in Excel, the narrative lives in a Word doc, and the executive summary ends up in a slide deck that doesn’t match either.
This isn’t unique to one organization. Delivery teams across enterprises face the same challenge: project data lives in multiple systems, but executives need a single, polished narrative for board meetings and client updates. Lucen Timeline addresses this friction point head-on. Originally built as Office Timeline, the product rebranded as Lucen Software in May 2026 as part of a broader positioning shift toward a “Microsoft-native clarity platform.” The core promise is simple: turn project data into board-ready timelines and Gantt charts without the manual rebuilding.
This review covers what the product actually does, how deep the Microsoft integration really goes in daily work, where it saves time against manual slide building, and where it falls short. Ahead: a feature walkthrough with annotated views, honest pros and cons, the use cases it fits, and a head-to-head with Excel for the same job.
Lucen Timeline at a glance: Who it suits
Timeline is a presentation layer, not a project management system. This distinction matters. The tool converts your existing project data into Gantt charts and timelines within PowerPoint. It’s exactly what the brand positioning promises: a Microsoft-native visualization tool that stays in your existing workflow without adding new systems.
Core capabilities:
- PowerPoint add-in and browser-based access with no additional login.
- Integrations with Excel, Jira, and Smartsheet.
- Automatic refresh when source data changes.
Independent ratings and adoption:
- Lucen claims 215k+ individual users, 200+ hours saved per user each year, and 9/10 satisfied customers.
- Lucen claims to be trusted by the majority of the Fortune 500.
- G2 shows a 4.4/5 rating from 15 reviews.
How Lucen Timeline Works: PowerPoint, Excel, and Browser
Installation and Data Connection
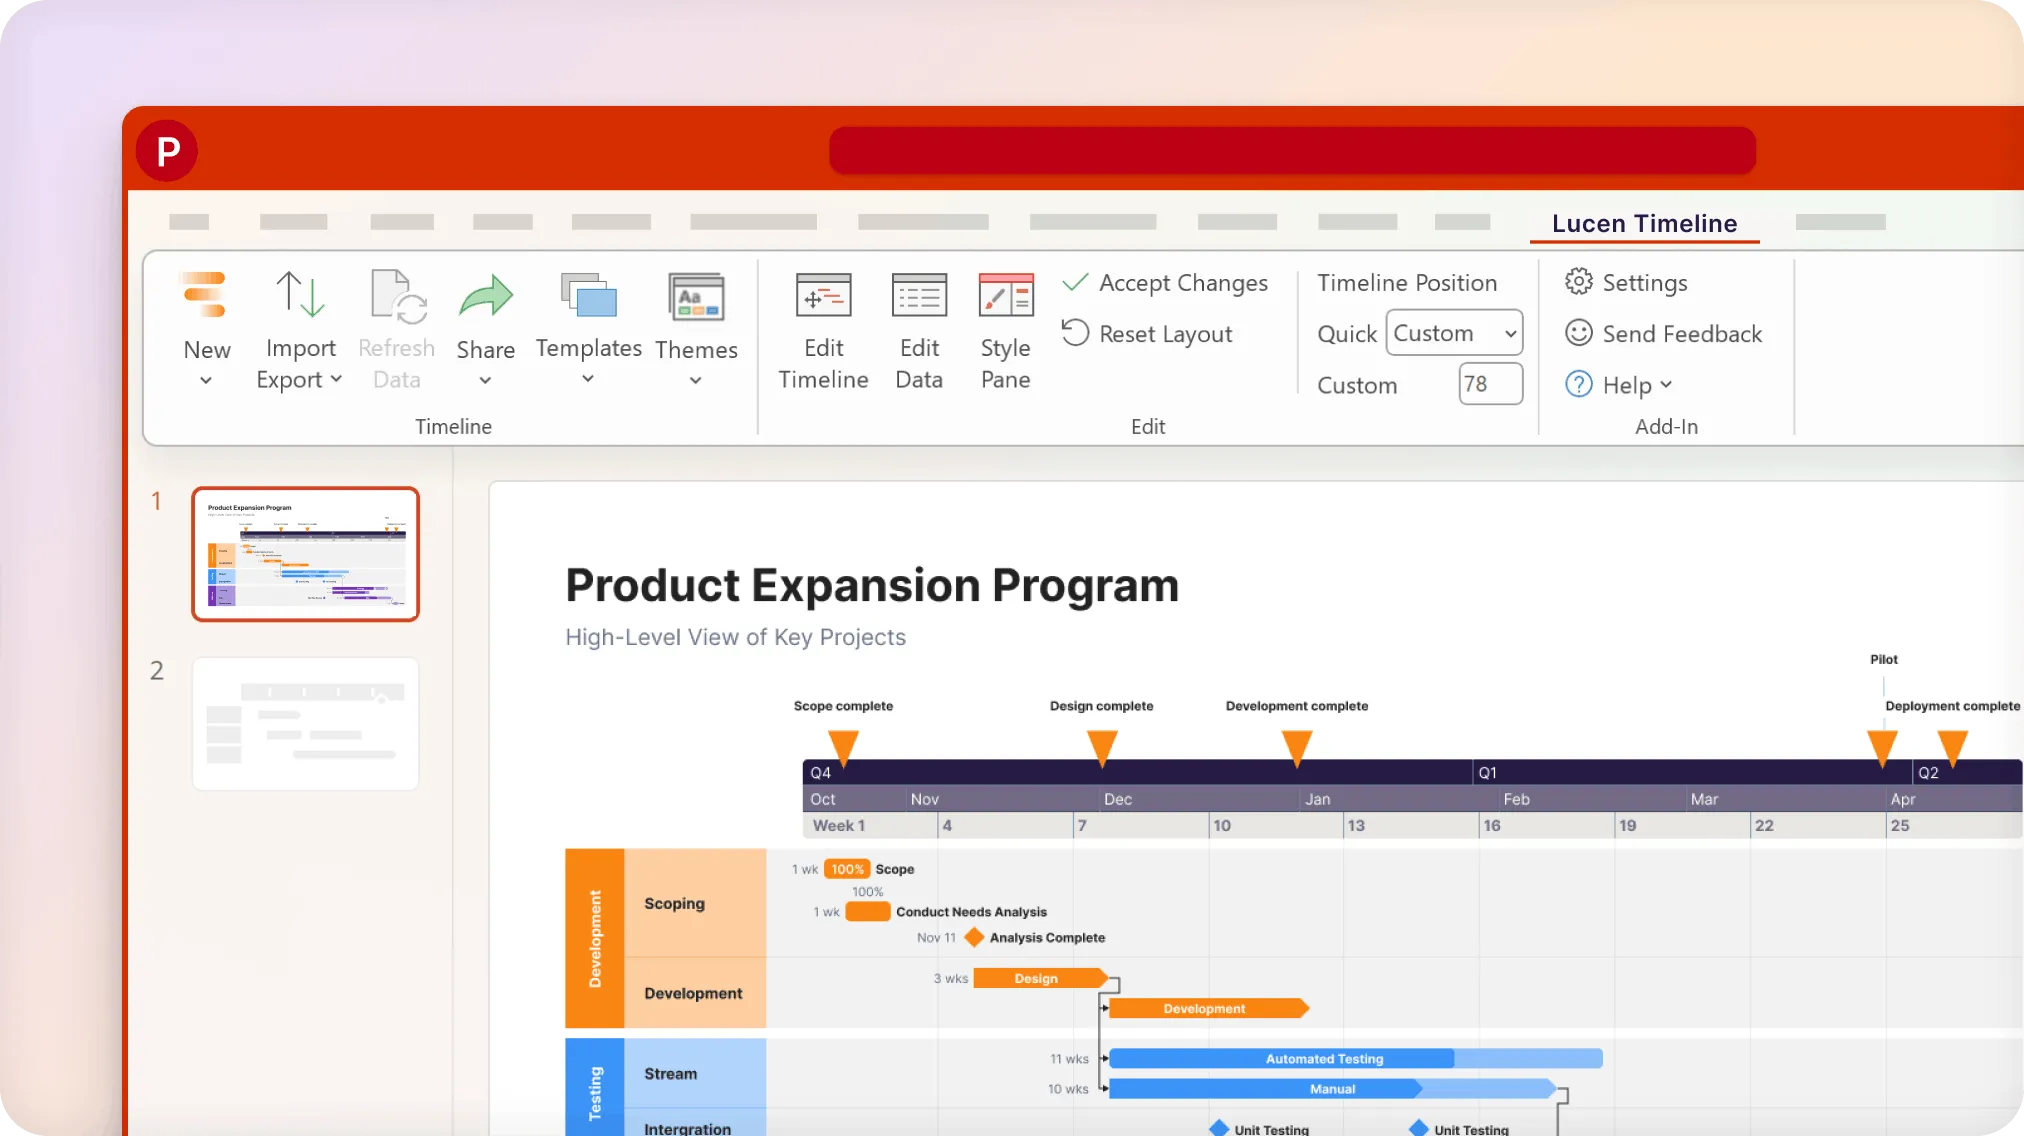
Lucen Timeline installs as an add-in to PowerPoint. Once activated, you open a configuration panel that prompts you to connect to your data source, Excel files, Jira boards, or Smartsheet workspaces. The tool pulls data without duplicating it; your source system remains the single source of truth.
If your project plan lives in Excel, Lucen connects to that spreadsheet directly. Instead of manually copying dates and milestones into PowerPoint each week—a process that’s error-prone and time-consuming—Lucen pulls that data live. When your Excel plan changes, one refresh updates your entire presentation. This is the core value: one source of truth in Excel, presentation-ready visuals in PowerPoint, no manual rebuilding.
Choosing Your View
You select your visualization format from multiple options to match your communication needs, whether showing strategic phases, execution-level tasks with dependencies, or portfolio-level initiative tracking. Presentation formatting is immediate; color schemes and styling can be customized to organizational standards.
Refresh Workflow
When your source data changes, refresh your timeline with a single click. All visual elements in your slide deck update instantly, no manual chart rebuilding, no copy-paste. Teams can refresh as often as their workflow requires, whether that’s before every stakeholder meeting or weekly status updates.
Browser Option
Lucen Timeline also offers a browser-based interface for teams who want full-screen planning space before condensing into PowerPoint. Build your timeline online, then move it directly into your PowerPoint slides. The browser option connects with the same data sources—Excel, Jira, Smartsheet— keeping your source of truth unchanged.
Three Core Views
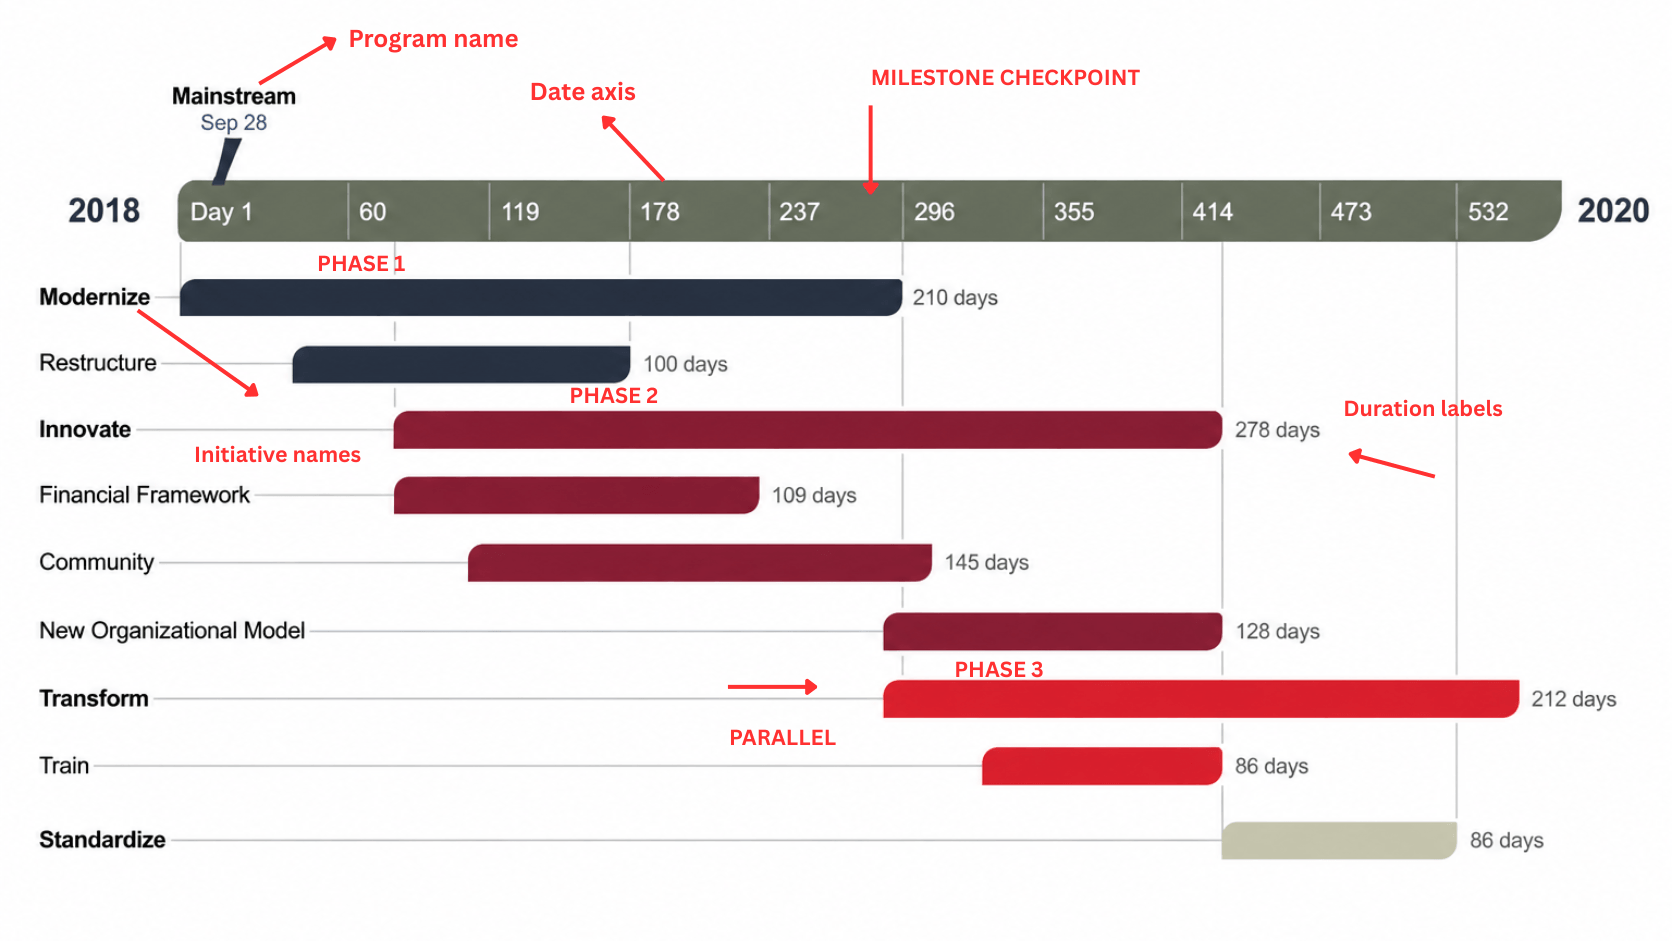
Lucen Timeline’s planning view showing parallel strategic initiatives (Mainstream program: Modernize, Restructure, Innovate, Financial Framework, Community, Transform, Train, Standardize) running concurrently over 2 years. Color-coding indicates program phases: Dark Navy for early initiatives (Modernize, Restructure), Dark Red for mid-program initiatives (Innovate, Financial Framework, Community, Transform, Train), and Light Tan for the closing phase (Standardize). Duration labels show each initiative’s length, and a milestone at Day 296 marks the mid-program review. The timeline spans Day 1 to Day 532 (2018-2020).
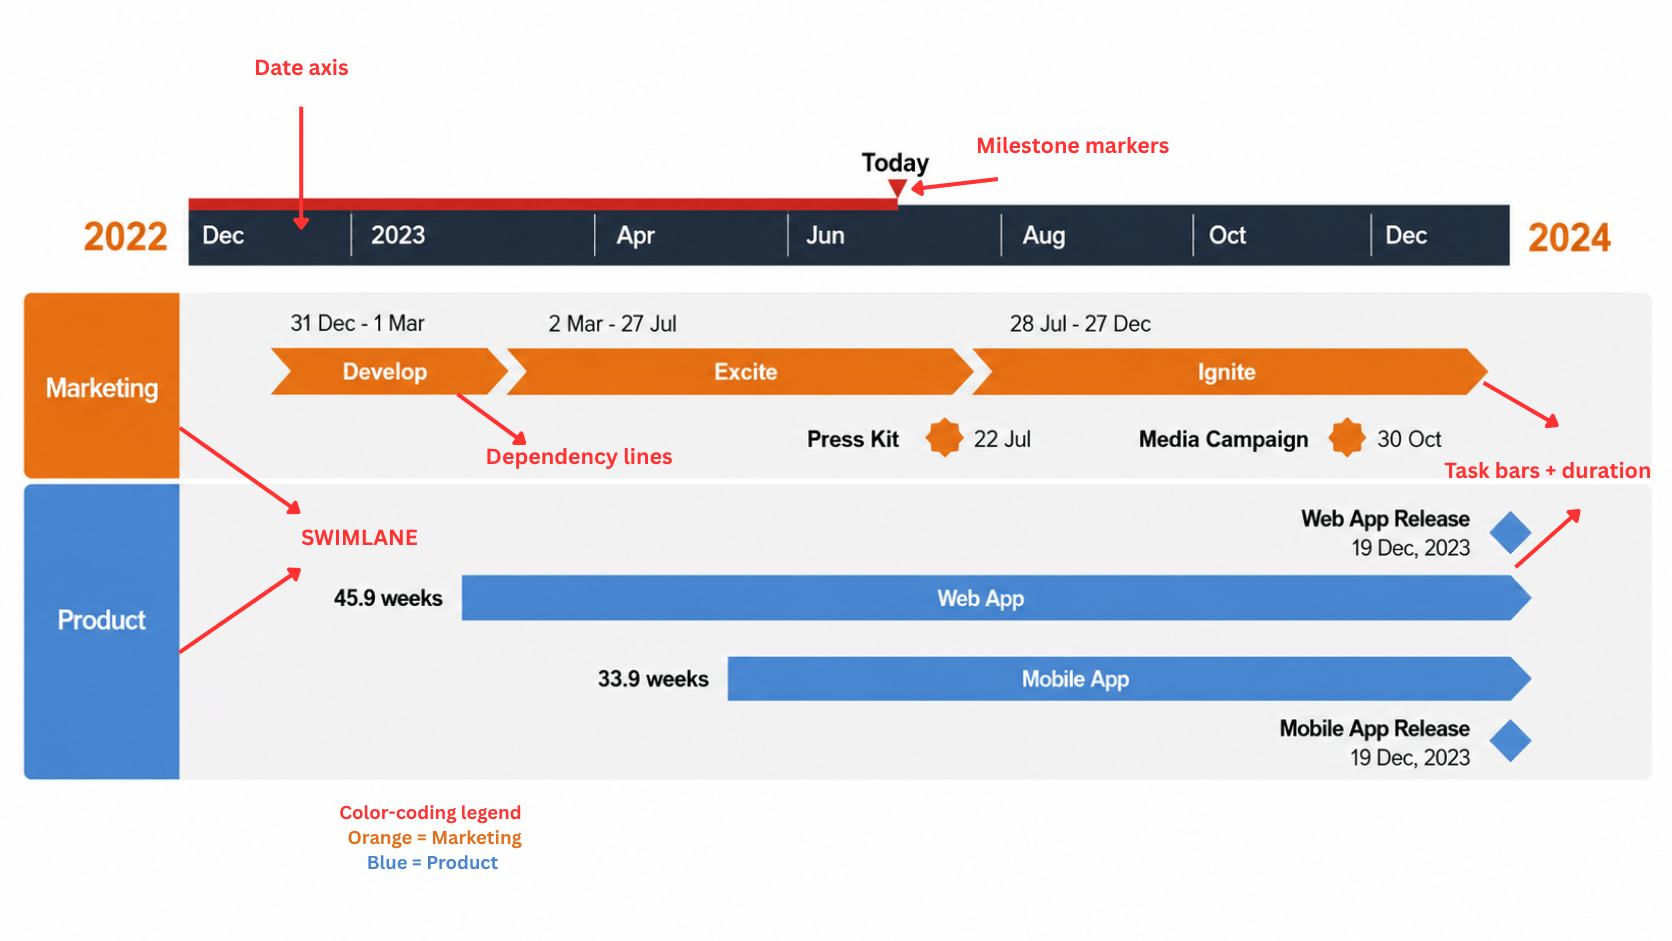
Lucen Timeline’s timeline view with swimlanes organized by team (Marketing and Product) coordinating a product launch. The three-phase workflow (Develop → Excite → Ignite) shows parallel marketing and product workstreams with color-coded task bars (orange for Marketing, blue for Product). Milestones mark key deliverables (Press Kit, Media Campaign, Web App Release, Mobile App Release), and dependencies visible as connecting arrows show the sequence between phases. The timeline spans December 2022 through December 2024, with duration labels showing each phase’s length.
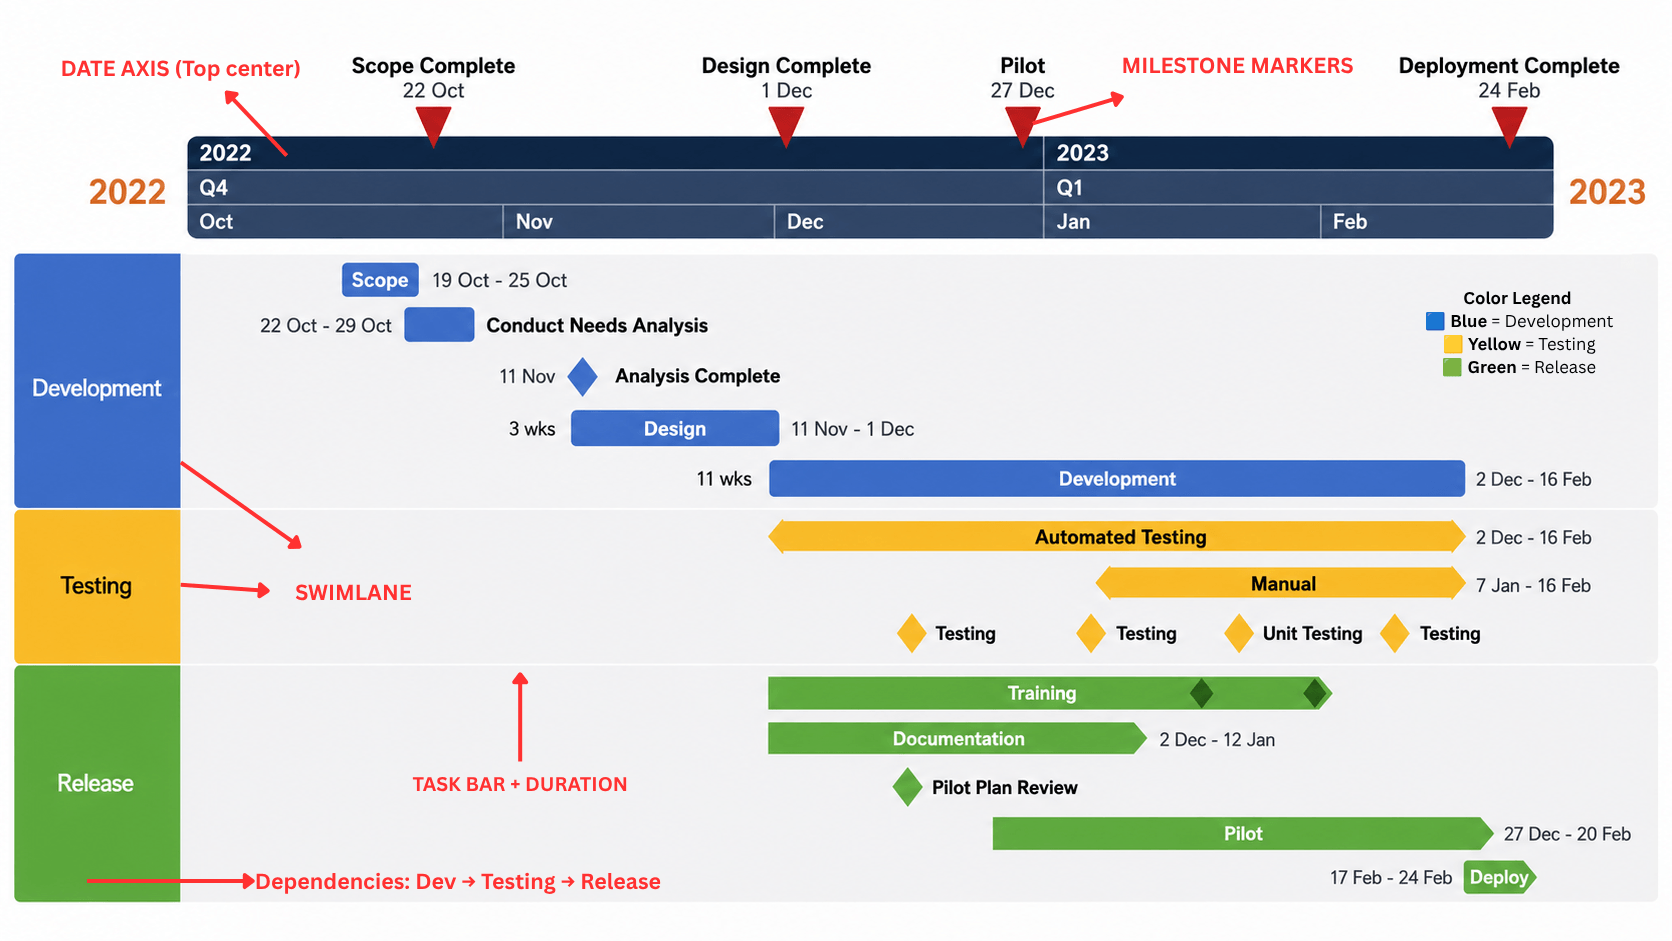
Lucen Timeline’s Gantt chart view with swimlanes organized by team (Development, Testing, Release). Each swimlane shows parallel phases with color-coded task bars, milestones marked at the top (red diamonds: Scope Complete, Design Complete, Pilot, Deployment Complete), and dependencies showing the workflow sequence (Dev → Testing → Release). The date axis spans October 2022 through February 2023, with task durations clearly labeled.
What Microsoft-native means here: Lucen Timeline is built to live inside PowerPoint, a tool your team already uses every day. There’s no separate login, no new platform to learn. You can pull source data from Excel, Jira, or Smartsheet, but your final timeline or Gantt chart appears directly in your PowerPoint slide. This is what “Microsoft-native” means: your work happens inside familiar Microsoft tools.
Pros and cons for Microsoft-native workflow fit, clarity, and team visibility
Lucen Timeline is a PowerPoint add-in with a browser version, so the honest question is not “is it powerful?” but “does it fit how your team already reports?”
Where it helps
- It lives inside Microsoft 365. You build the timeline in PowerPoint rather than exporting an image from another tool and pasting it into a deck. For a Microsoft-first PMO, that removes the weekly rebuild step and keeps slide layout and brand accuracy intact.
- It reads from the systems you already keep data in. Timeline integrates with Excel, Jira, and Smartsheet, so the sprint or task data stays where the delivery team maintains it, and the slide reflects it.
- Milestones and dependencies get easier to explain. Gantt charts and swimlane-style timelines are the format executives and clients read fastest — useful for steering committee decks and status reviews where the audience needs sequence and handoffs, not a task backlog.
Where it falls short
- It is not a project management platform. There is no task assignment or delivery control here. You still need Jira, Smartsheet, or Microsoft Project as the source of record.
- Raw data work belongs elsewhere. For critical-path calculation, resource levelling, or heavy what-if modelling, Excel and Microsoft Project remain more flexible — Excel especially, if your planning logic lives in formulas.
Who Lucen Timeline is For, and When It’s the Right Choice
Lucen Timeline is designed for project managers, program managers, PMO leads, delivery managers, and consultants who spend significant time communicating status to executives and clients. If your team already works in Microsoft 365 and needs board-ready visuals faster, Lucen Timeline is worth evaluating.
Weekly status decks are the strongest use case. Teams that update executive dashboards every week benefit most from automation that eliminates manual slide rebuilding. Steering committee updates are equally strong. When leadership needs visual clarity on milestones, dependencies, and blockers, Lucen Timeline delivers that in PowerPoint without hours of formatting work.
Client delivery plans also benefit. Consultants and delivery managers can show clients professional timelines directly in PowerPoint, updating in minutes rather than hours. Portfolio reporting showing cross-project dependencies and overall portfolio health is another strong fit when multiple projects need coordinated visuals.
Lucen Timeline is less suitable if your primary need is a full project management system. Teams that need robust task tracking, resource allocation, or daily team coordination should use dedicated project management platforms. Lucen Timeline excels at one specific job: turning project data into visuals that leadership can scan. It does that job through native integration with Microsoft 365 tools your team already uses.
The core value is simple: when your goal is communicating status clearly and quickly to stakeholders, and your team is already in Microsoft 365, Lucen Timeline removes the manual work that makes status reporting slow.
LUCEN TIMELINE VERSUS EXCEL FOR STATUS REPORTING
The tradeoff is plain: Excel for analysis and one-off models, Lucen Timeline when the deliverable is a visual update stakeholders act on. Many teams use both — Excel as the data layer, Lucen Timeline as the reporting layer.
Request a Demo to see how other PMOs use Lucen Timeline to scale visibility across concurrent programs and departments.
Frequently asked questions
Yes. Lucen Timeline is built to work natively inside PowerPoint and integrates with Excel within Microsoft 365. It’s not a separate platform—it’s an add-in that extends tools you already use daily. Your data stays in Excel or Microsoft Project; Lucen simply transforms it into presentation-ready visuals. If your team works in PowerPoint and Excel, Lucen feels native to your workflow.
Lucen Timeline integrates with Jira, Excel, Smartsheet, Microsoft Project, and Wrike. You point it at your source system, and it pulls the data to create the timeline or Gantt chart. Updates are manual, not real-time, so your team controls when timelines refresh. If your project data lives in one of these tools, Lucen can visualize it without manual copy-paste work.
Excel and Lucen Timeline serve different jobs. Excel is built for planning, task tracking, and calculations. Lucen Timeline is built for visual communication. Teams typically use both: Excel for organizing project details and logic, Lucen Timeline for turning that data into clear slides for stakeholders. Excel handles the complexity; Lucen handles the clarity. One source of truth. No reformatting waste.
Yes. Lucen Timeline offers both a PowerPoint add-in and a browser-based version. Teams can build and refine timelines in full-screen planning space online, then move them directly into PowerPoint slides for presentations. Both versions connect to the same data sources: Excel, Jira, Smartsheet, Microsoft Project, and Wrike, keeping your source of truth unchanged across workflows.
Project management visualization: tips and tricks
Ready to Get Started?
Ready to compare Lucen Timeline with your current status reporting workflow? Download the free trial and test it with your own project data to see the time savings and clarity gains directly.

Subscribe to our blog
Get all the tips, tricks and inspiration you need to create professional looking timelines, straight to your inbox.