How to make a swimlane diagram in PowerPoint
To create a swimlane diagram in PowerPoint, draw one long rectangle per lane, using Insert > Shapes or a one-column table, and label each lane with a role or team. Then add flowchart shapes inside the lanes and join them with elbow connectors. For a faster build, Lucen Flowchart creates swimlane diagrams as native PowerPoint shapes, and auto layout keeps every step in its lane as you edit.
A swimlane diagram is a type of flowchart that shows who does what and how a process flows between departments within an organization. The swimlanes help to visually group items into categories in order to illustrate how responsibilities are assigned across departments. Professionals who craft effective swimlane diagrams achieve better results in describing complex processes and making them more approachable.
On this page, we show you how to make a swimlane diagram in PowerPoint two ways: manually, with PowerPoint's own shapes, and automatically, with Lucen Flowchart, a PowerPoint add-in that drafts the lanes, steps and handoffs for you.
How to manually make a swimlane diagram in PowerPoint
1. Create swimlanes.
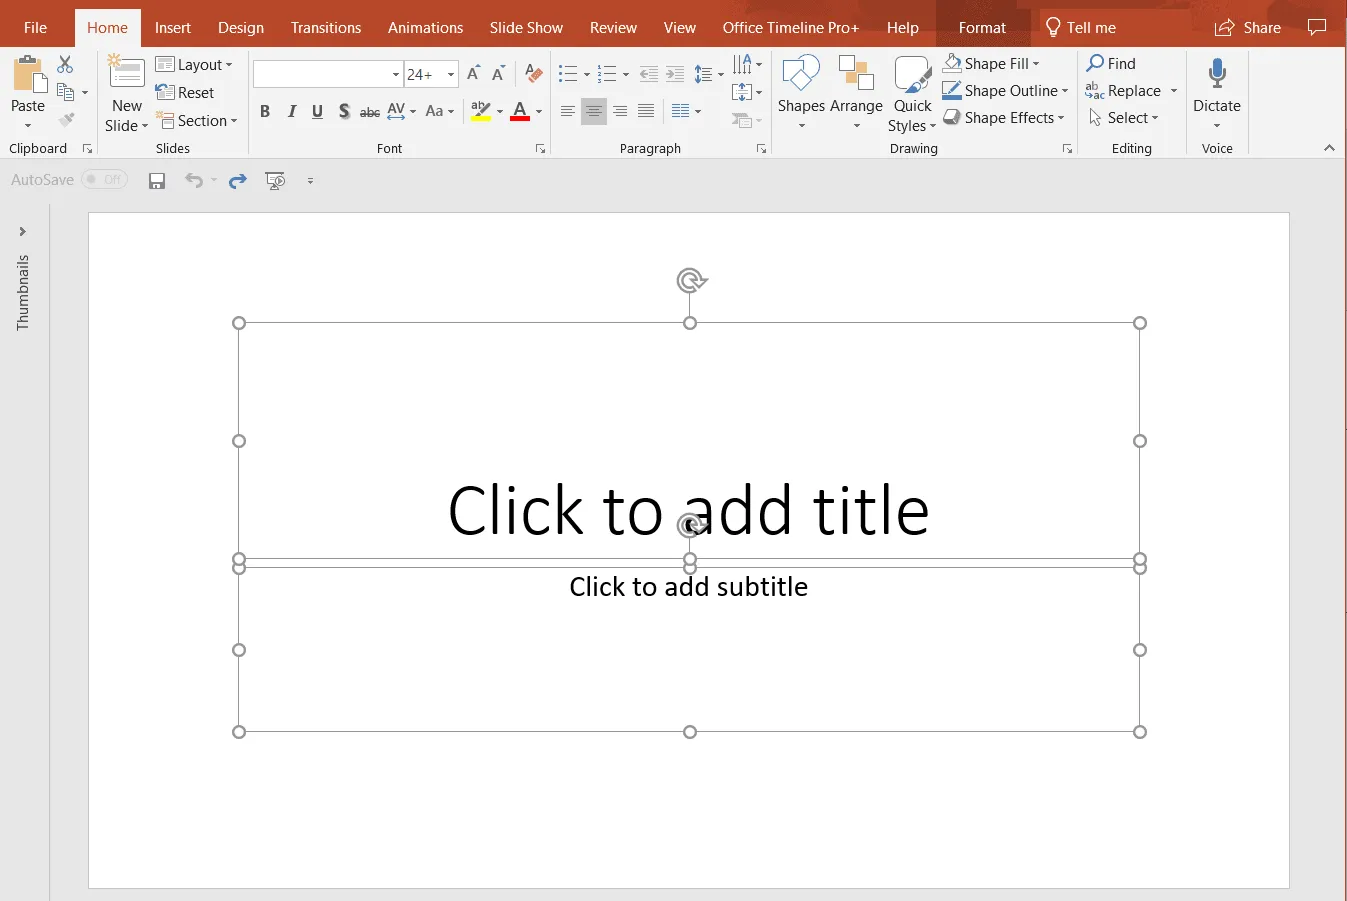
a) Open PowerPoint and select a new blank presentation.
b) Select and delete the default text boxes on the slide that opens.
c) Go to the Insert tab, click Shapes, and add a large rectangle to your slide. This will be the main part of your swimlane.
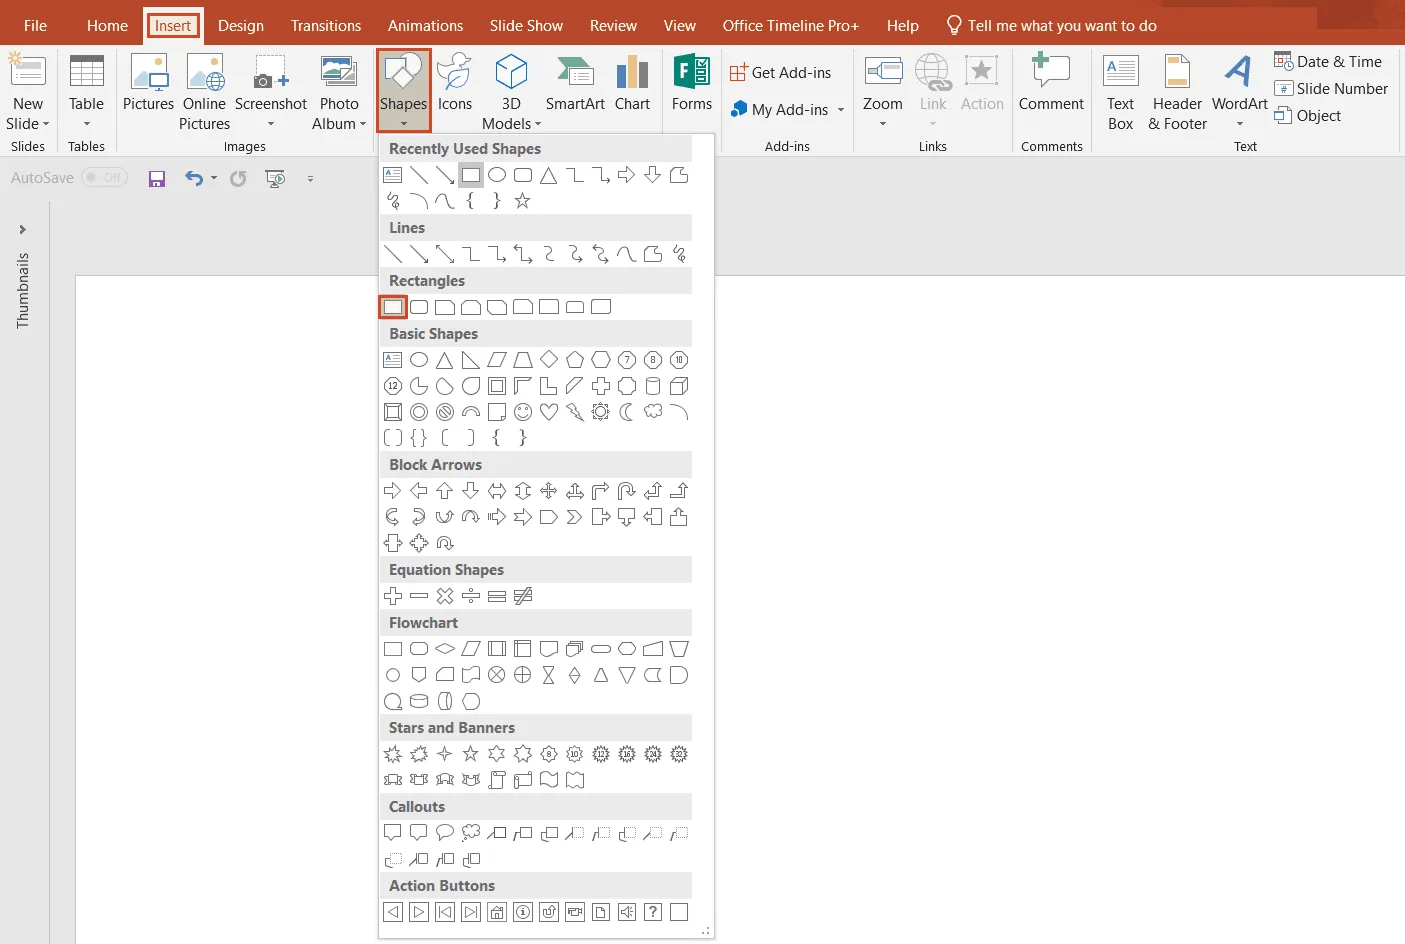
d) Add another rectangle on the left to use it as the title section of your swimlane.
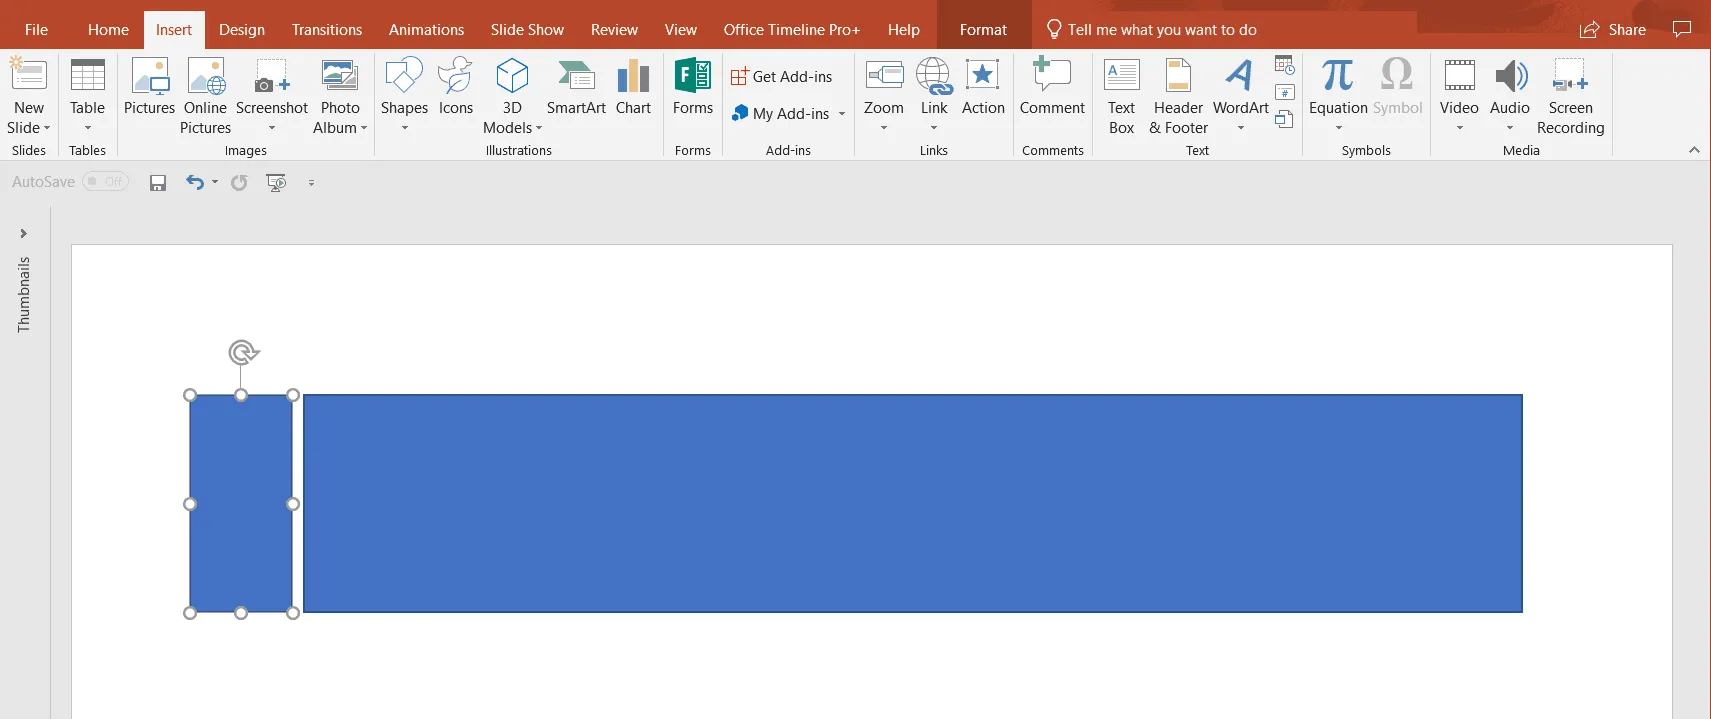
e) Group the shapes so that you can unify them and apply changes to both at once.
i. To do this, first position the shapes as needed. Then, select both shapes, right-click and select Group > Group. (Later on, if you find that you’d rather handle shapes separately, you can ungroup them just as easily: right-click and select Group, then Ungroup).
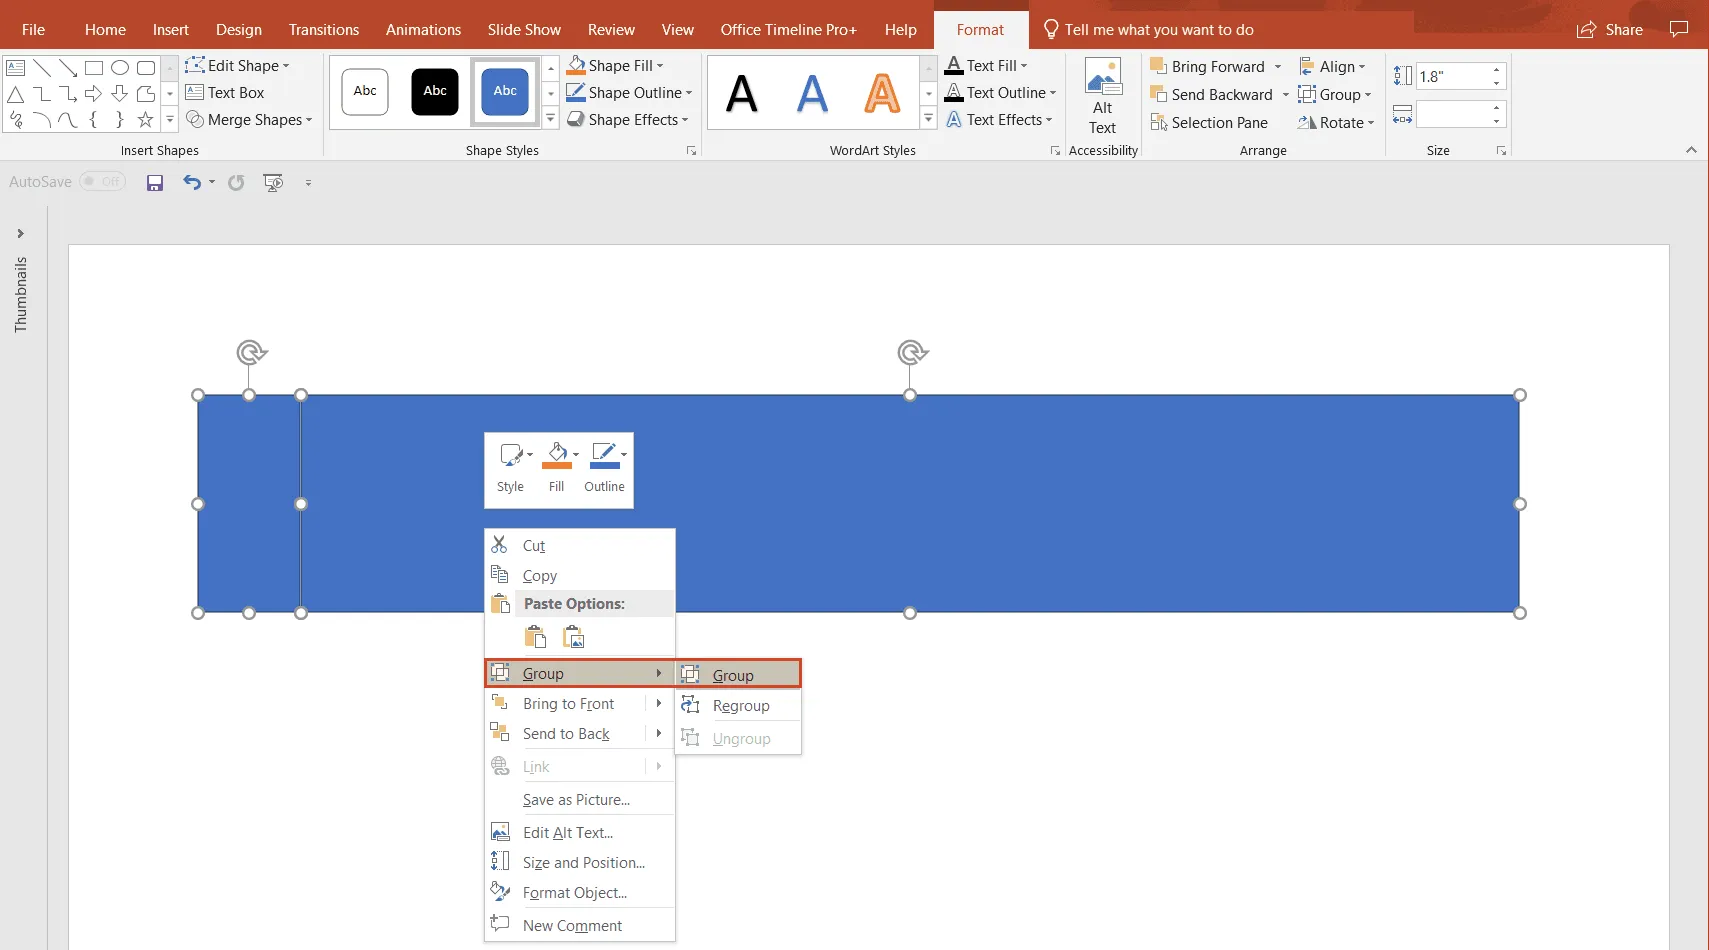
ii. Now, if you want, you can change the color and the default outline of the entire swimlane (both body and title sections). Select the two items and then use the Fill and Outline options to recolor them. In our example, we chose a transparent background and a dark grey outline.

iii. When done, copy-paste your swimlane as many times as necessary.
2. Add labels to your swimlanes.
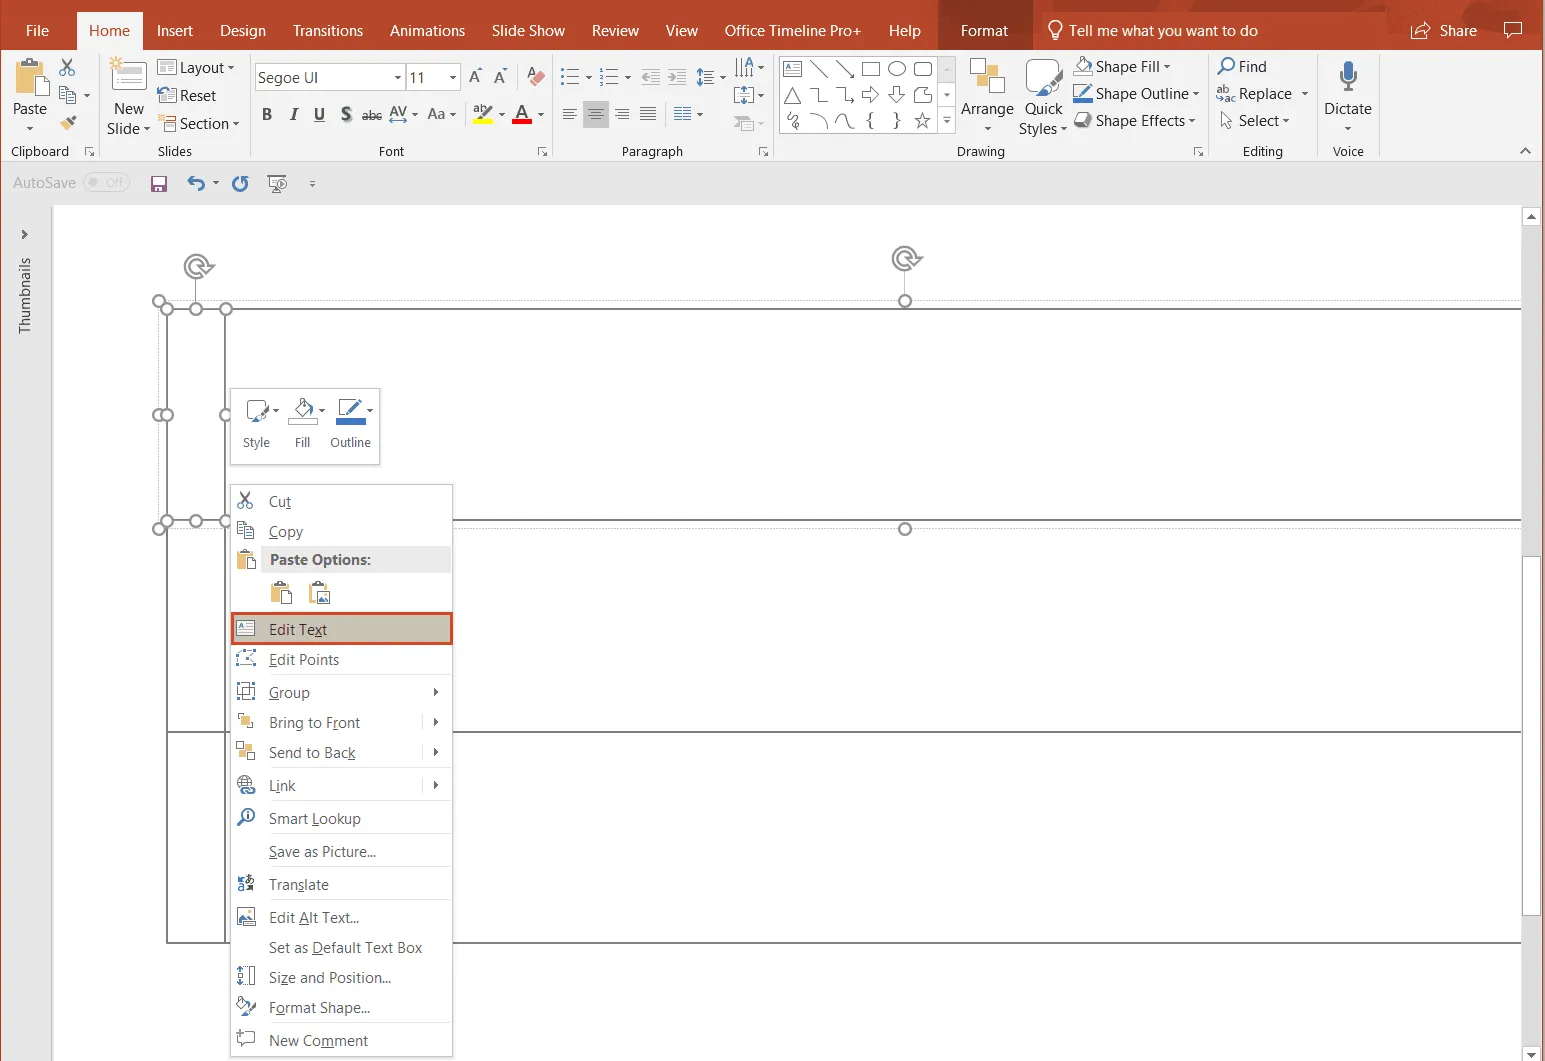
a) To type the relevant participants in the title section, select the shape, right-click on its edge, select Edit Text and start typing.
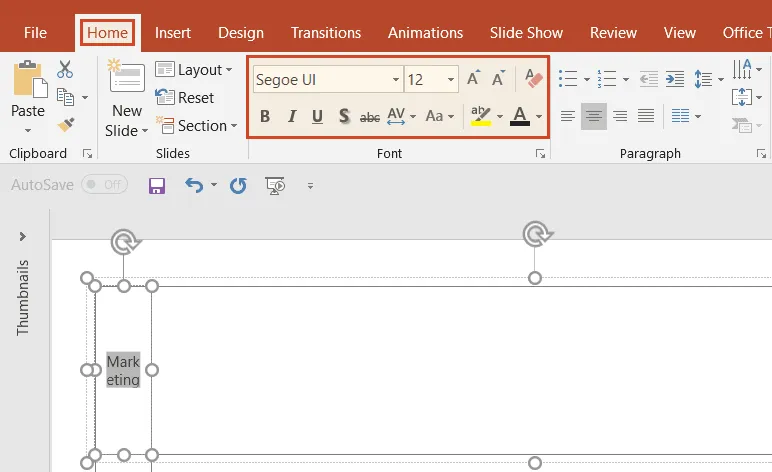
b) You can customize the text as needed: change size, color, or style using the options in Home > Font.
c) To change text orientation, right-click on the text, select Format Shape, then go to Shape Options > Size & Properties > Text Box > Text direction. We chose the option Rotate all text 270°.
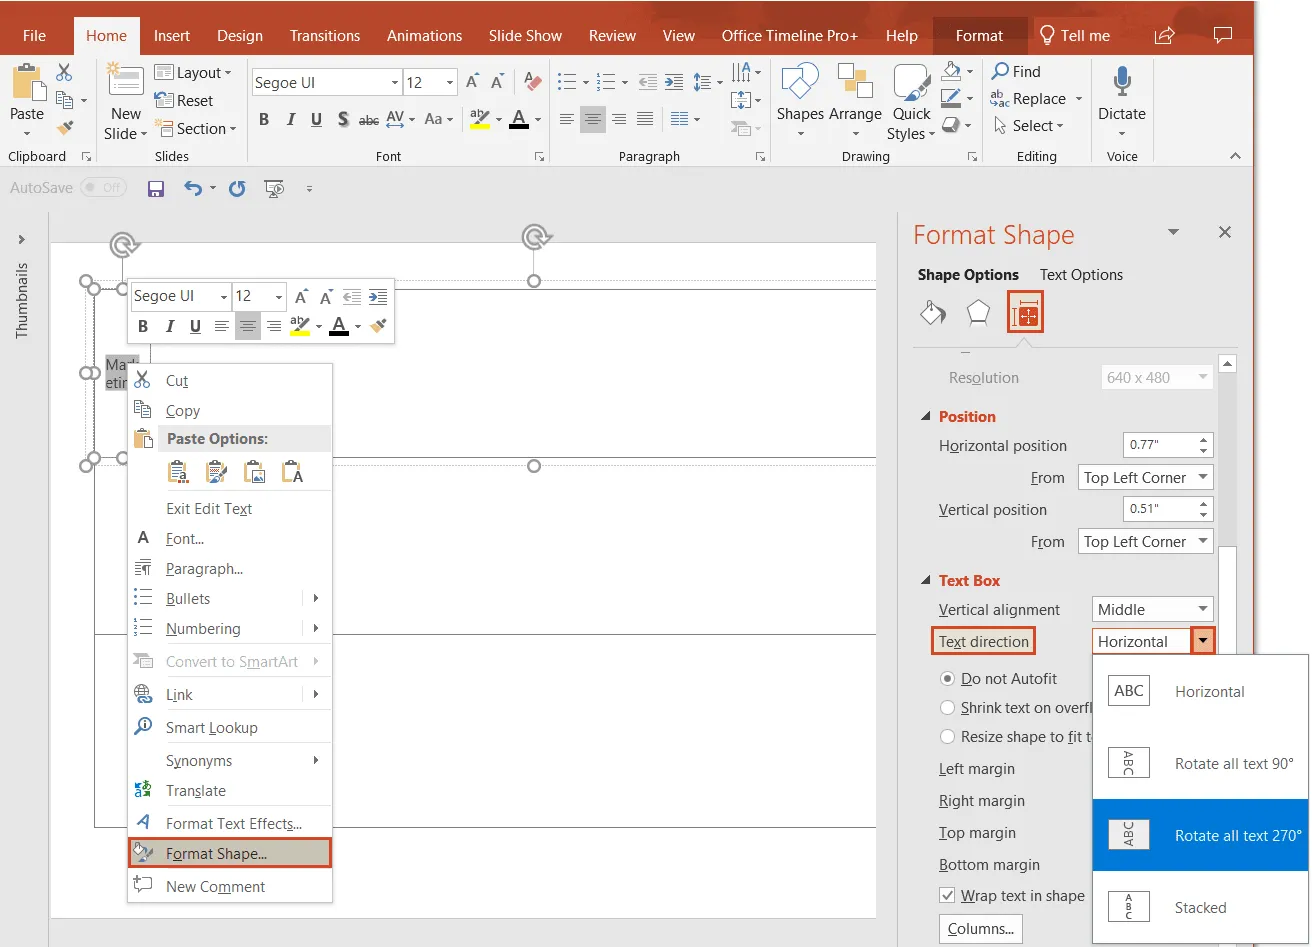
d) To change the color of a title section, right-click on the shape and select the preferred option from the Fill color palette.

3. Build a flowchart.
Now that you’ve created your swimlanes, you need to add a flowchart to illustrate how the steps of your process are distributed and connected.
a) To add flowchart items, insert shapes from the Shapes section of the Insert tab.
b) When choosing the shapes, keep in mind the swimlane diagram rules and conventions: per current ISO standards, this type of diagram flows from top to bottom and left to right. Also, flowchart shapes have different roles. For instance, the “Flowline” (arrow) shows the order of operations, the “Process / Activity” shape (rectangle) represents a set of operations, the “Terminal” shape (oval rectangle) is set at the beginning and end of a program, etc.
c) Use the orientation indicators (the red dotted line that shows up when dragging items) in PowerPoint to place and align shapes.
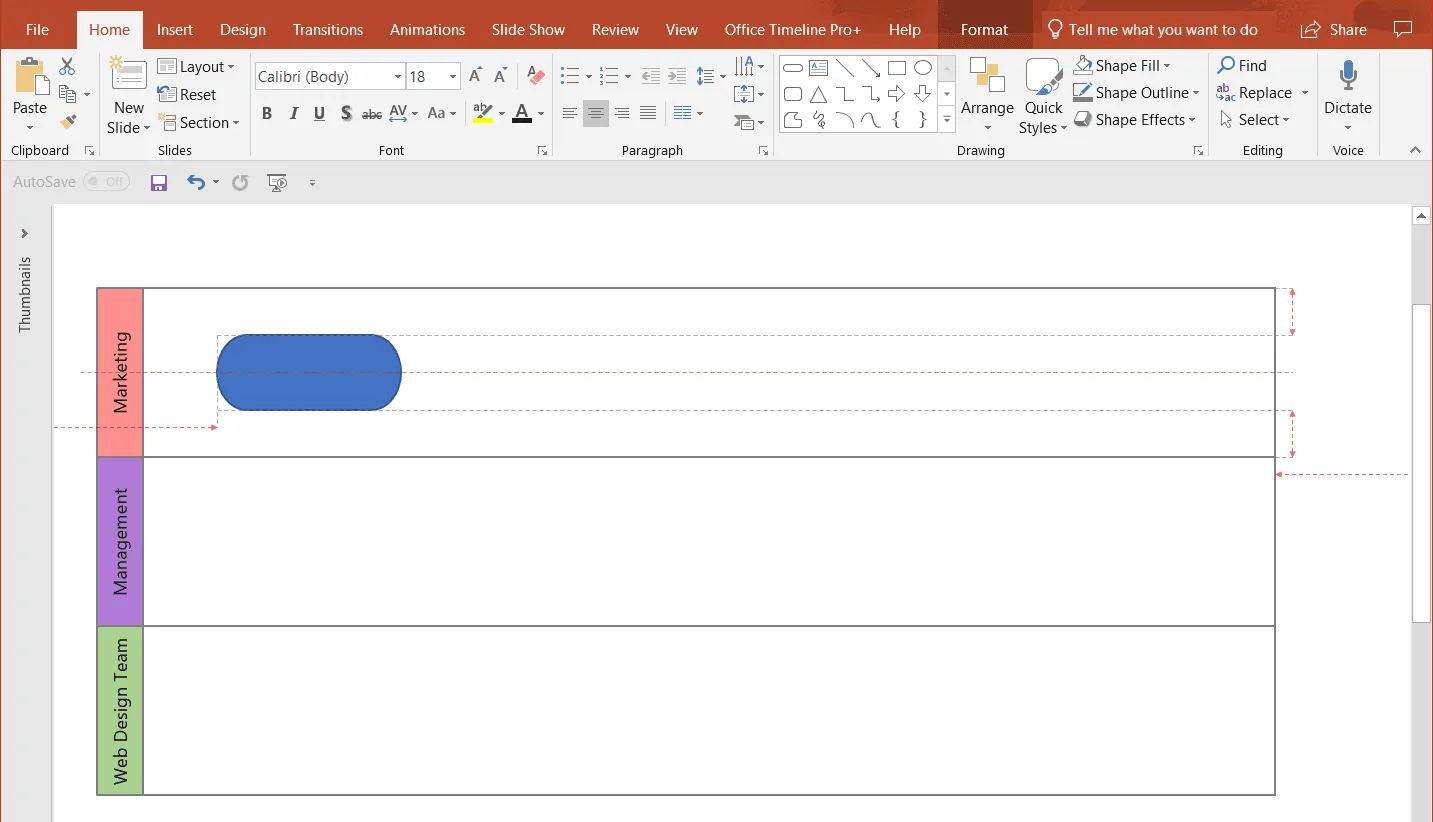
d) Insert connectors (arrows). Again, go to Insert > Shapes and select the arrow shape. Draw an arrow from one shape to another and make sure the connecting points turn green, so that the connecting arrows stick to the shapes when you move them around.
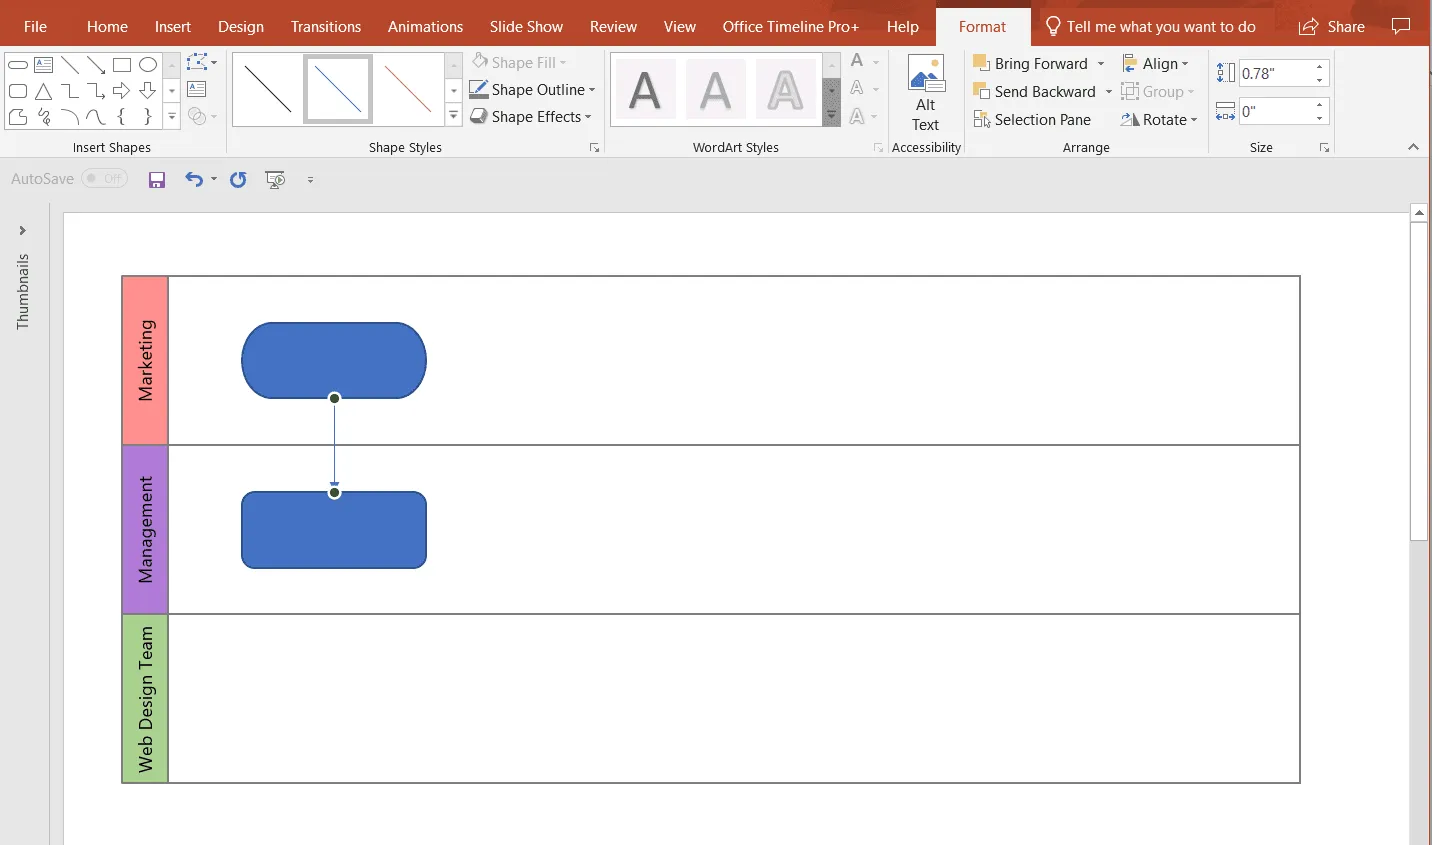
4. Customize your swimlane diagram.
a) To check and adjust shape size, select the shape, and access Format > Size.
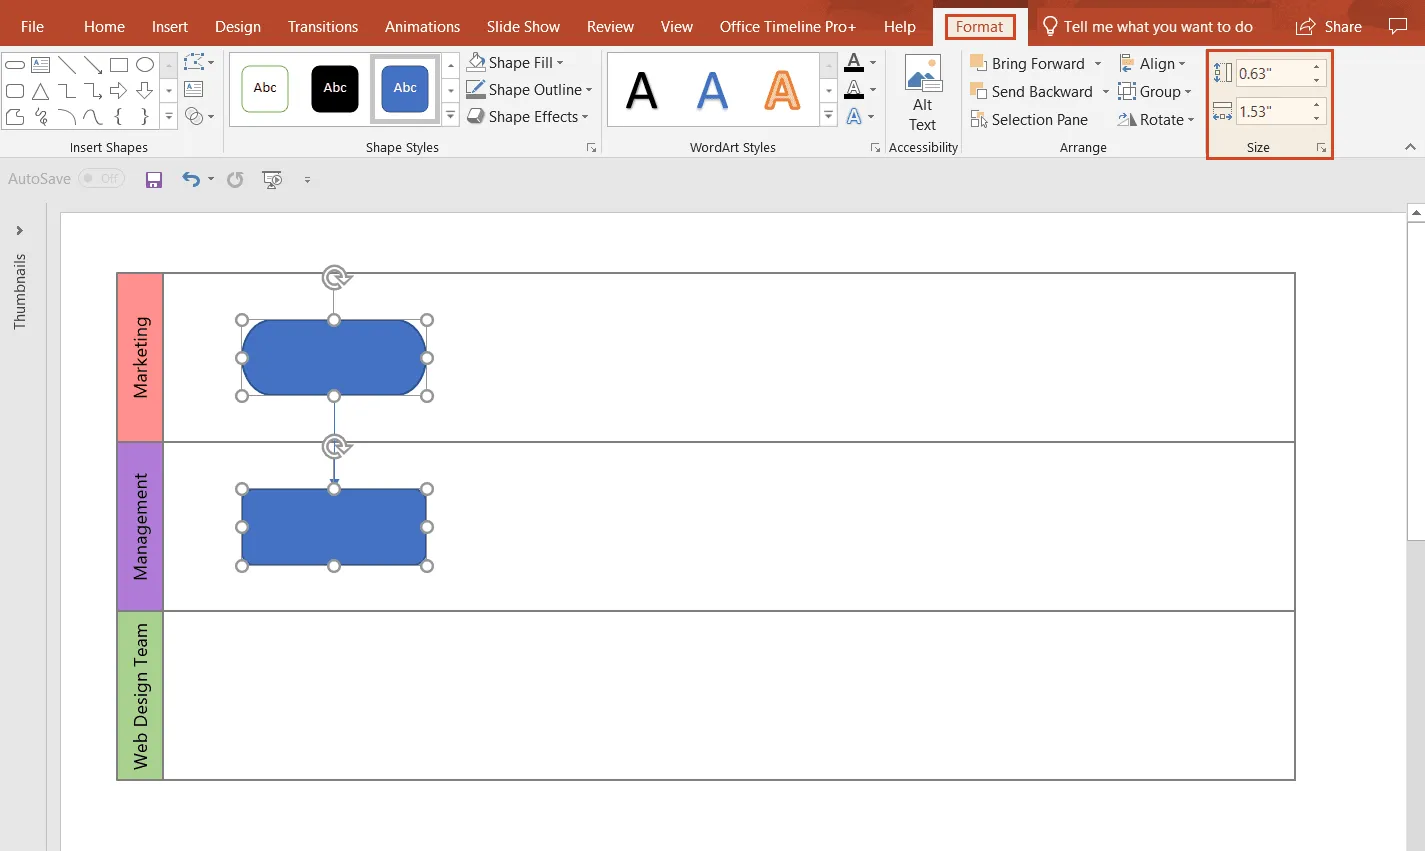
b) In the Format tab, you’ll find the options needed to customize the colors, fonts, and sizes of your flowchart shapes and to better organize the content of your diagram. Select the shape you want to format, then change its color or outline style using the tools in the Format tab. We chose to color shapes according to their roles (same role, same color) to make processes easy to track at a glance.
c) To label a shape, just double-click on it and start writing. You can then easily change the font style, size and/or color after you select the text to edit and use the sizing and styling options in Home > Font.
d) Add text boxes near the “Decision” shape (diamond) indicating which path the process will take. The “Decision” shape will usually contain a yes/no question or a true/false test, so you’ll need to insert yes/no or true/false to show directions in each case. For this, go to Insert > Text > Text Box and place the text box in the vicinity of the diamond shape, as needed. Customize font in Home > Font.
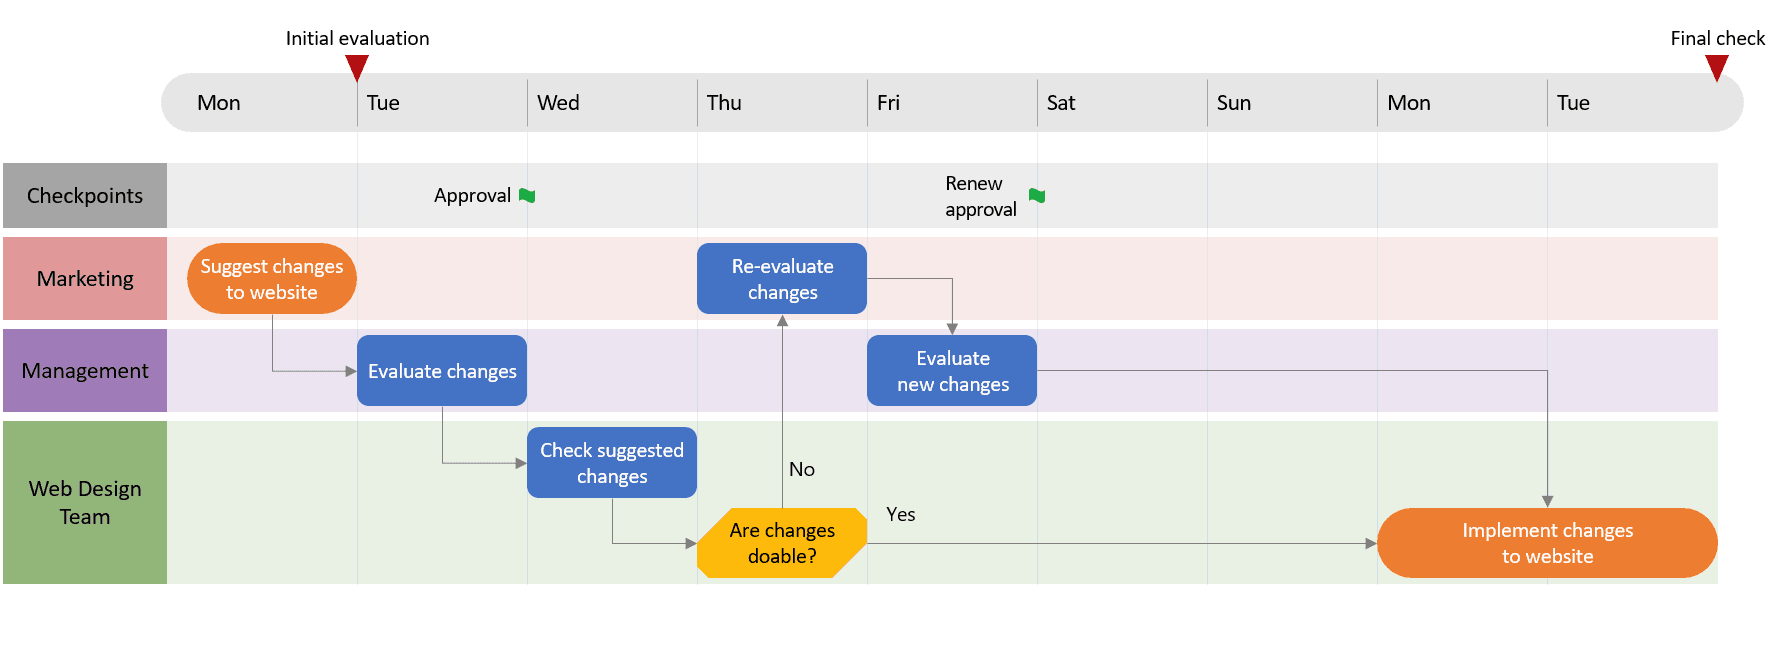
After customizing the labels, size and color of the swimlane-associated objects and adding text boxes near the Decision shape to indicate the possible routes that our process can take, the final swimlane diagram that we manually created in PowerPoint looks like this:
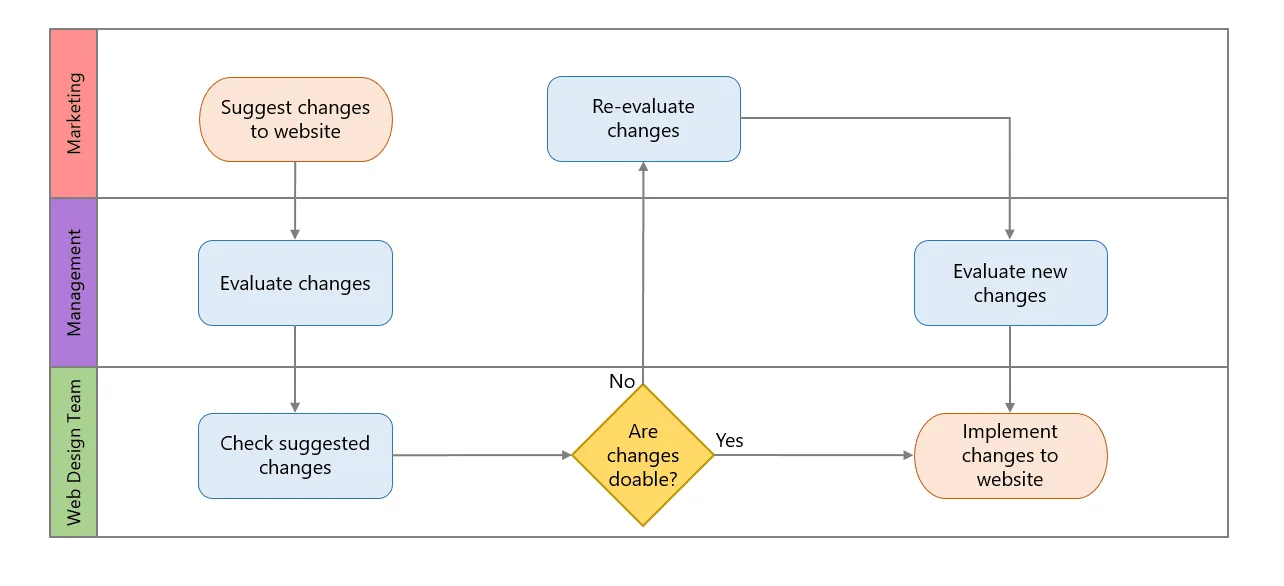
Download manual PowerPoint swimlane diagram slide
If you’d like to use the swimlane diagram created in this guide as a template to help you move faster, you can download the slide below, free of charge.
Get this free swimlane diagram template

Does PowerPoint have a swimlane template?
PowerPoint has no built-in swimlane layout in SmartArt. You can build your own with the steps above and save the slide as a template, or use an add-in with ready-made swimlane templates such as Lucen Flowchart.

How to automatically make a swimlane diagram in PowerPoint
Lucen Flowchart is a PowerPoint add-in that builds swimlane diagrams as native, editable PowerPoint shapes, directly on your slide.
- Open Lucen Flowchart from the PowerPoint ribbon.
- Describe the process and its owners, for example: "Sales submits the order. Finance checks credit. If approved, Operations ships it and Finance sends the invoice." Or start from a swimlane template.
- Review the draft. Lucen AI places each step in its owner's lane and connects the handoffs.
- Edit it on the slide. Add a step, move it to another lane or add a new lane. Auto layout re-spaces the shapes and reroutes connectors, keeping every step inside its lane.
Swimlanes are included in the Lucen Flowchart Plus plan. The diagram follows your presentation theme's colors and fonts, and anyone you share the deck with can edit it without Lucen installed.
Swimlane diagram best practices
- Keep it to two to six lanes. More than that is hard to read on one slide. Split the process instead.
- Name lanes by role, not by person. "Finance" outlasts "Maria."
- Make handoffs obvious. Every line that crosses a lane is a handoff and a likely place for delays. Call out the slow ones.
- Flow in one direction. Avoid lines that double back across the slide.
- Use one level of detail. Don't mix high-level stages with detailed tasks in the same diagram.
FAQs about making swimlane diagrams in PowerPoint
Find out below the answers to the most frequently asked questions on how to make a swimlane diagram using the popular presentation platform.
Draw one long rectangle per lane with Insert > Shapes (or use a one-column table), label each lane with a role or team, then place flowchart shapes inside the lanes and join them with elbow connectors.
The easiest way is a PowerPoint add-in like Lucen Flowchart. Describe the process and its owners, and Lucen AI drafts the lanes, steps and handoffs as editable PowerPoint shapes. Auto layout keeps every step in its lane as you edit.
PowerPoint has no built-in swimlane layout in SmartArt. You can build your own with the steps on this page and save the slide as a template, download the free swimlane slide above, or use an add-in with ready-made swimlane templates such as Lucen Flowchart.
Build swimlane diagrams in PowerPoint with Lucen Flowchart
Describe your process and who owns each step, and Lucen Flowchart drafts the lanes, steps and handoffs as editable PowerPoint shapes.