Timelines in data science
Understand how timelines power data science. Learn methods for trend analysis, forecasting, visualization, and decision-making with time-based data.

Exploring the role of timelines in modern data science workflows
Time adds the structure that raw data often lacks. In data science, timelines expose how patterns form, how behavior shifts, and how trends evolve. They turn isolated data points into sequences you can interpret, compare, and use to forecast what comes next.
Find out how timelines help data scientists interpret trends, build accurate forecasts, detect emerging signals, and make better decisions grounded in temporal evidence.

Time series analysis
Learn how data scientists break complex time-dependent data into trends, seasonal cycles, and irregular components.

Visualizing data trends
Discover how timelines reveal long-term movement, sudden shifts, and relationships across multiple variables.

Using timelines for predictions
See how historical sequences fuel predictive models, from lag variables and temporal features to the techniques that turn past behavior into future insight.


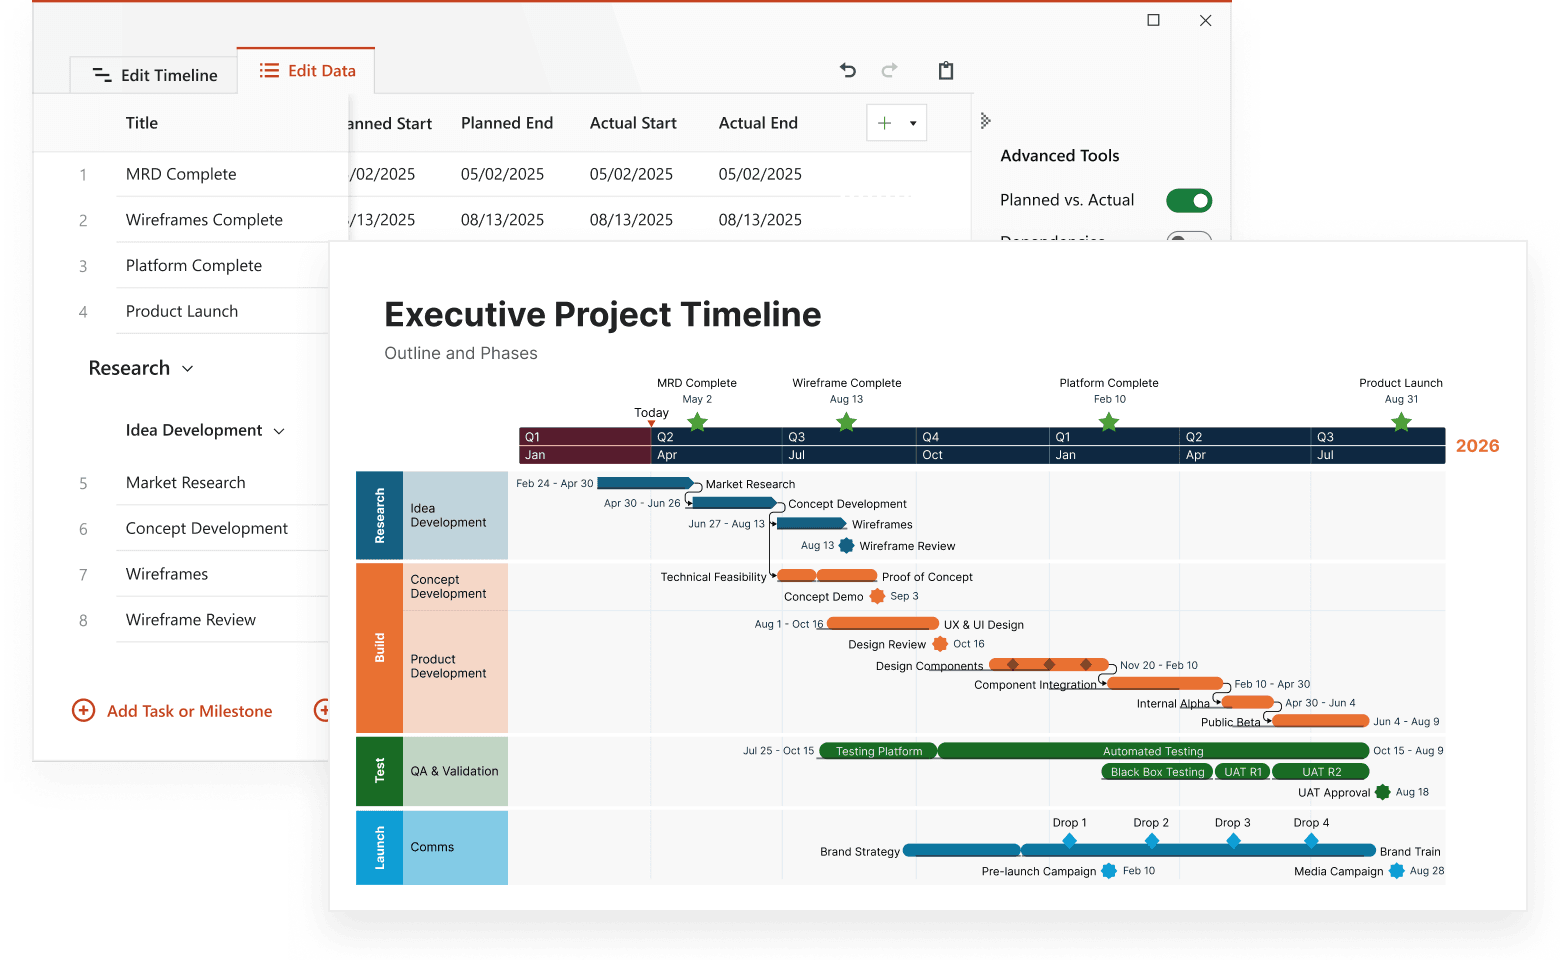
Executive-ready timelines in under 2 minutes
Professionals use Lucen Timeline's PowerPoint add-in to transform project data into polished visuals for client and executive communications. Integrates with popular productivity tools to build and update timeline slides instantly.