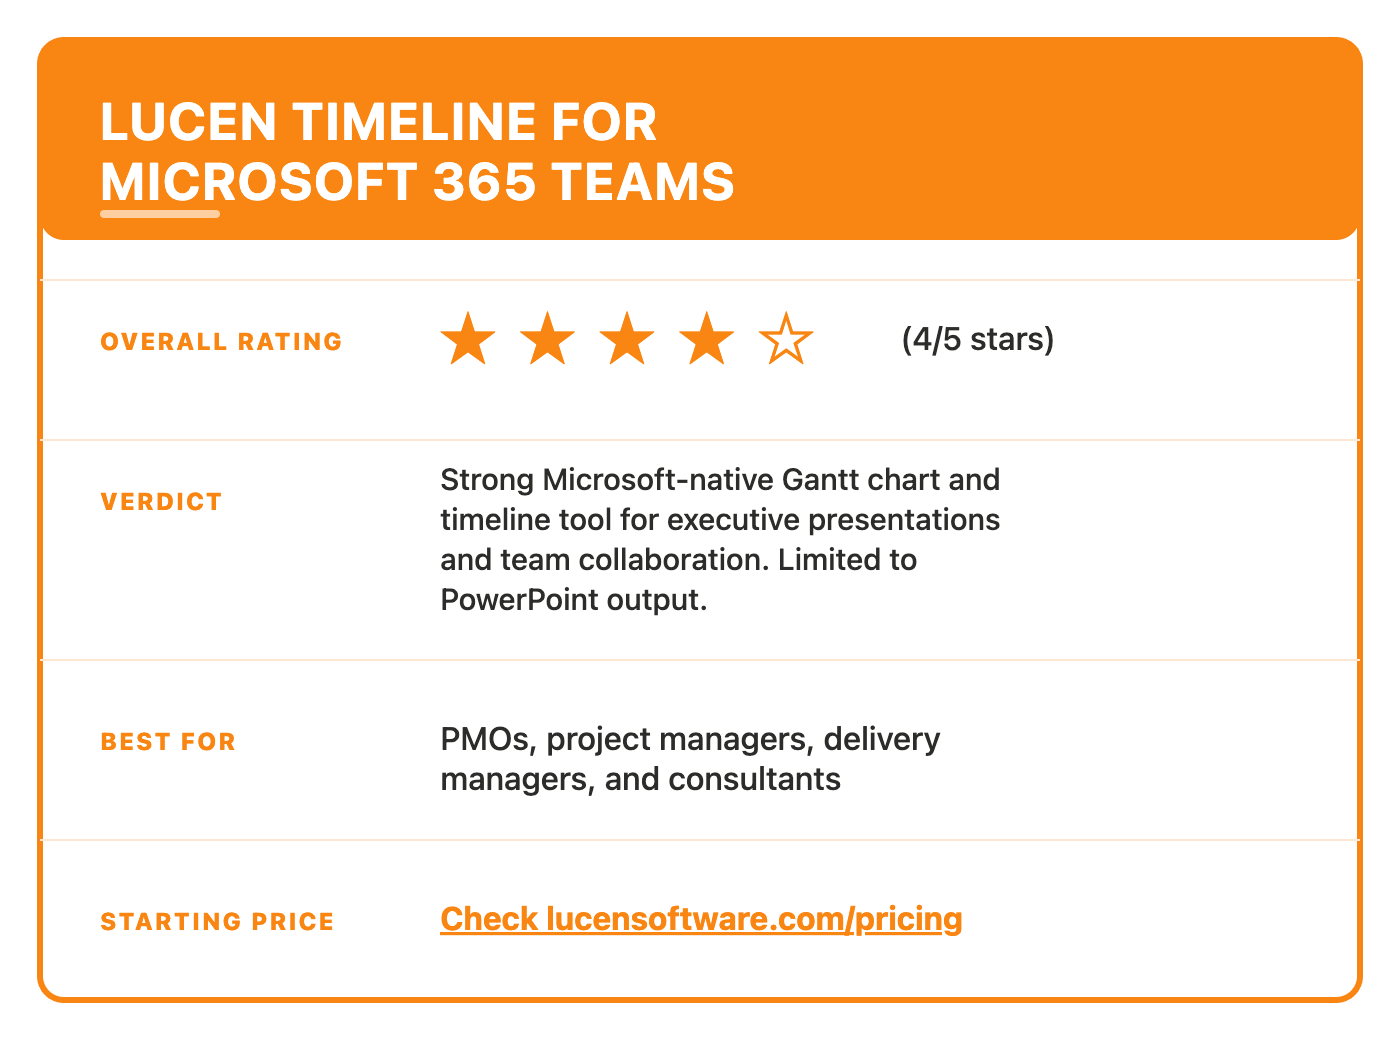


Step 1: Set up the PowerPoint workflow and decide whether you need a Gantt chart, a flowchart, or both
Most teams export schedules and process maps from separate tools as pictures, then rebuild them whenever something changes. Lucen Flowchart, now generally available, removes that step: describe a process, let Lucen AI draft it, and every shape stays native and editable on the slide you present from.
Then match the feature to the use case:
- Gantt chart: dates, task durations, dependencies, milestones, percent complete, and planned vs. actual status for an executive update.
- Flowchart: process steps, decision points, swimlanes, and handoffs: SOPs, onboarding, approvals, escalations, and audit workflows.
- Both: a plan slide plus a process slide in the same file, which is how most program reviews are actually structured.
Before you build, line up:
- Windows desktop PowerPoint 2016 or newer, including Microsoft 365
- Access to Lucen Timeline, Lucen Flowchart, or both
- A rough source plan: a task list with dates, or the process steps in order
From a template, expect a usable first draft in one sitting; a presentation-ready deck takes longer if you are importing data or starting from a blank slide. Next: building each chart type, keeping it editable, and picking the right tool.
Step 2: Build a flowchart in PowerPoint with Lucen Flowchart
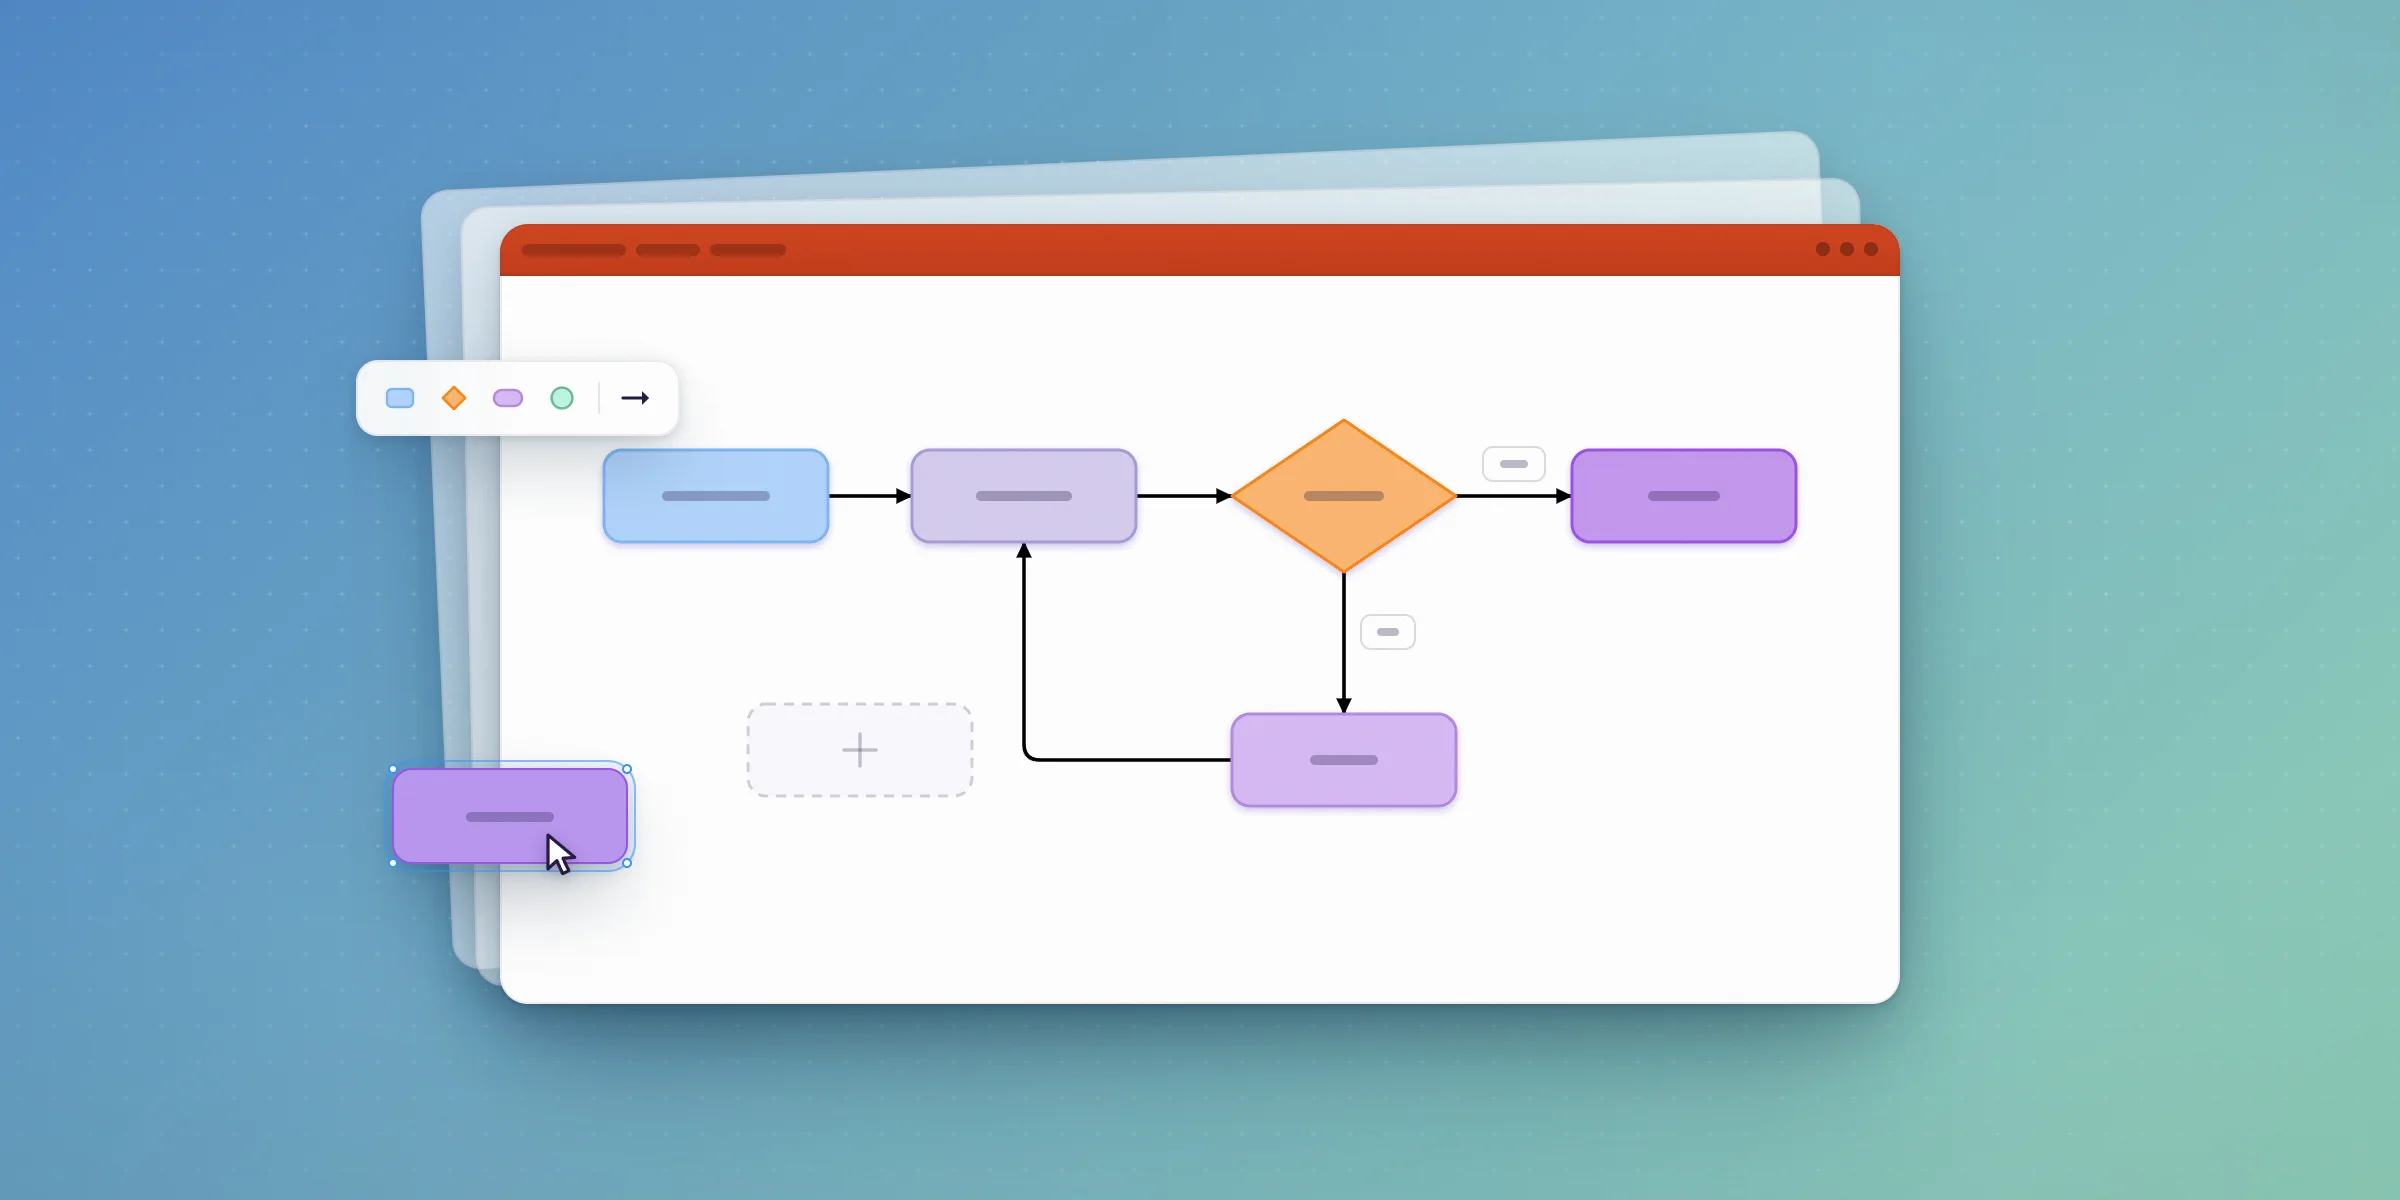
Open PowerPoint on Windows and launch Lucen Flowchart from the ribbon. The add-in runs entirely inside PowerPoint 2016 and newer, including Microsoft 365, so there's no separate canvas or browser tab to manage. The first time, sign in with your Lucen account.
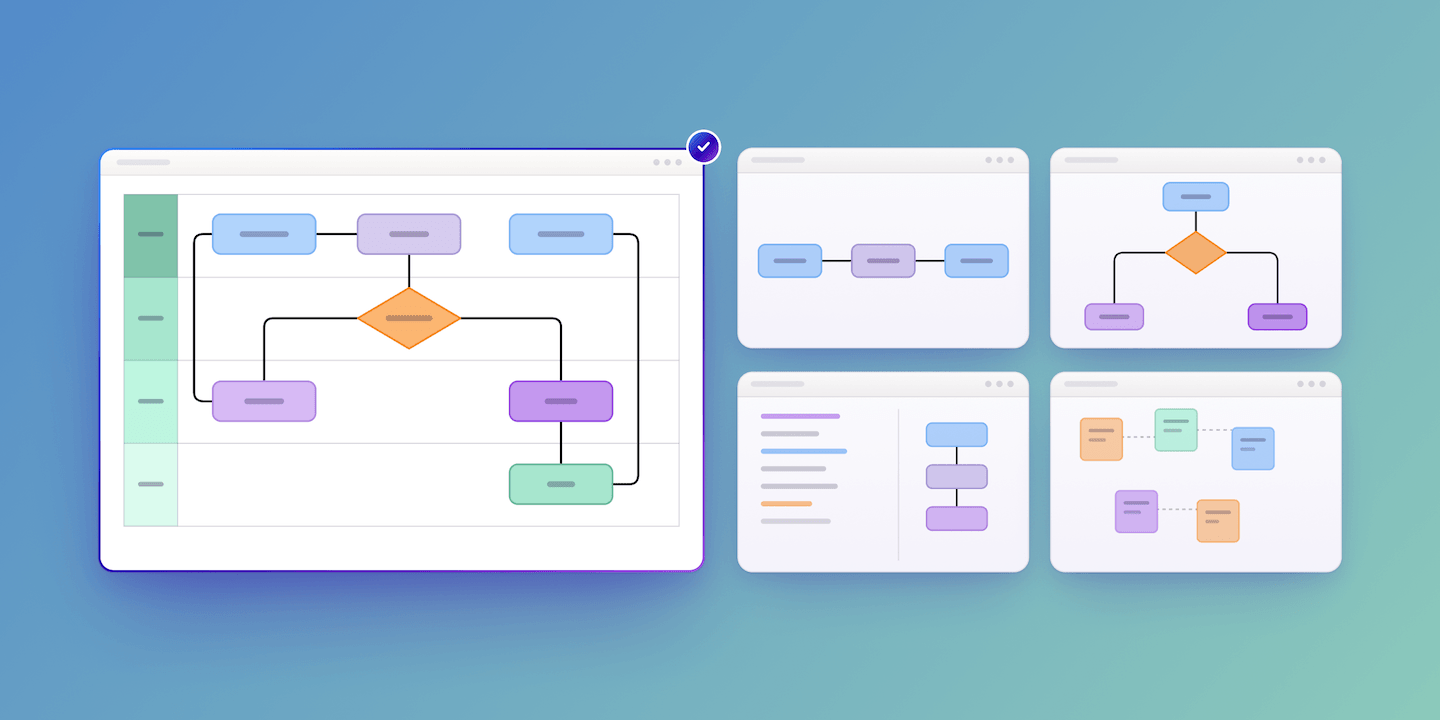
Then choose how to start: pick a ready-to-use template, describe the process in plain language and let Lucen AI draft it as native shapes on your slide, or insert and connect your own shapes. If the diagram gets cluttered, run Auto layout to realign shapes and reroute connectors. It respects your swimlanes when it rearranges.
When the approver changes two weeks later, click the shape, retype the owner's name, and drag the connector to the new decision point. Everything Flowchart creates is a native PowerPoint shape, so anyone can open and edit the deck without Lucen installed.
Match the diagram type to the feature you actually need. Lucen Flowchart covers process flow diagrams, decision trees, swimlane diagrams, standard operating procedures and work instructions, onboarding workflows, client delivery processes, approval and escalation workflows, cross-functional workflows, and compliance and audit workflows.
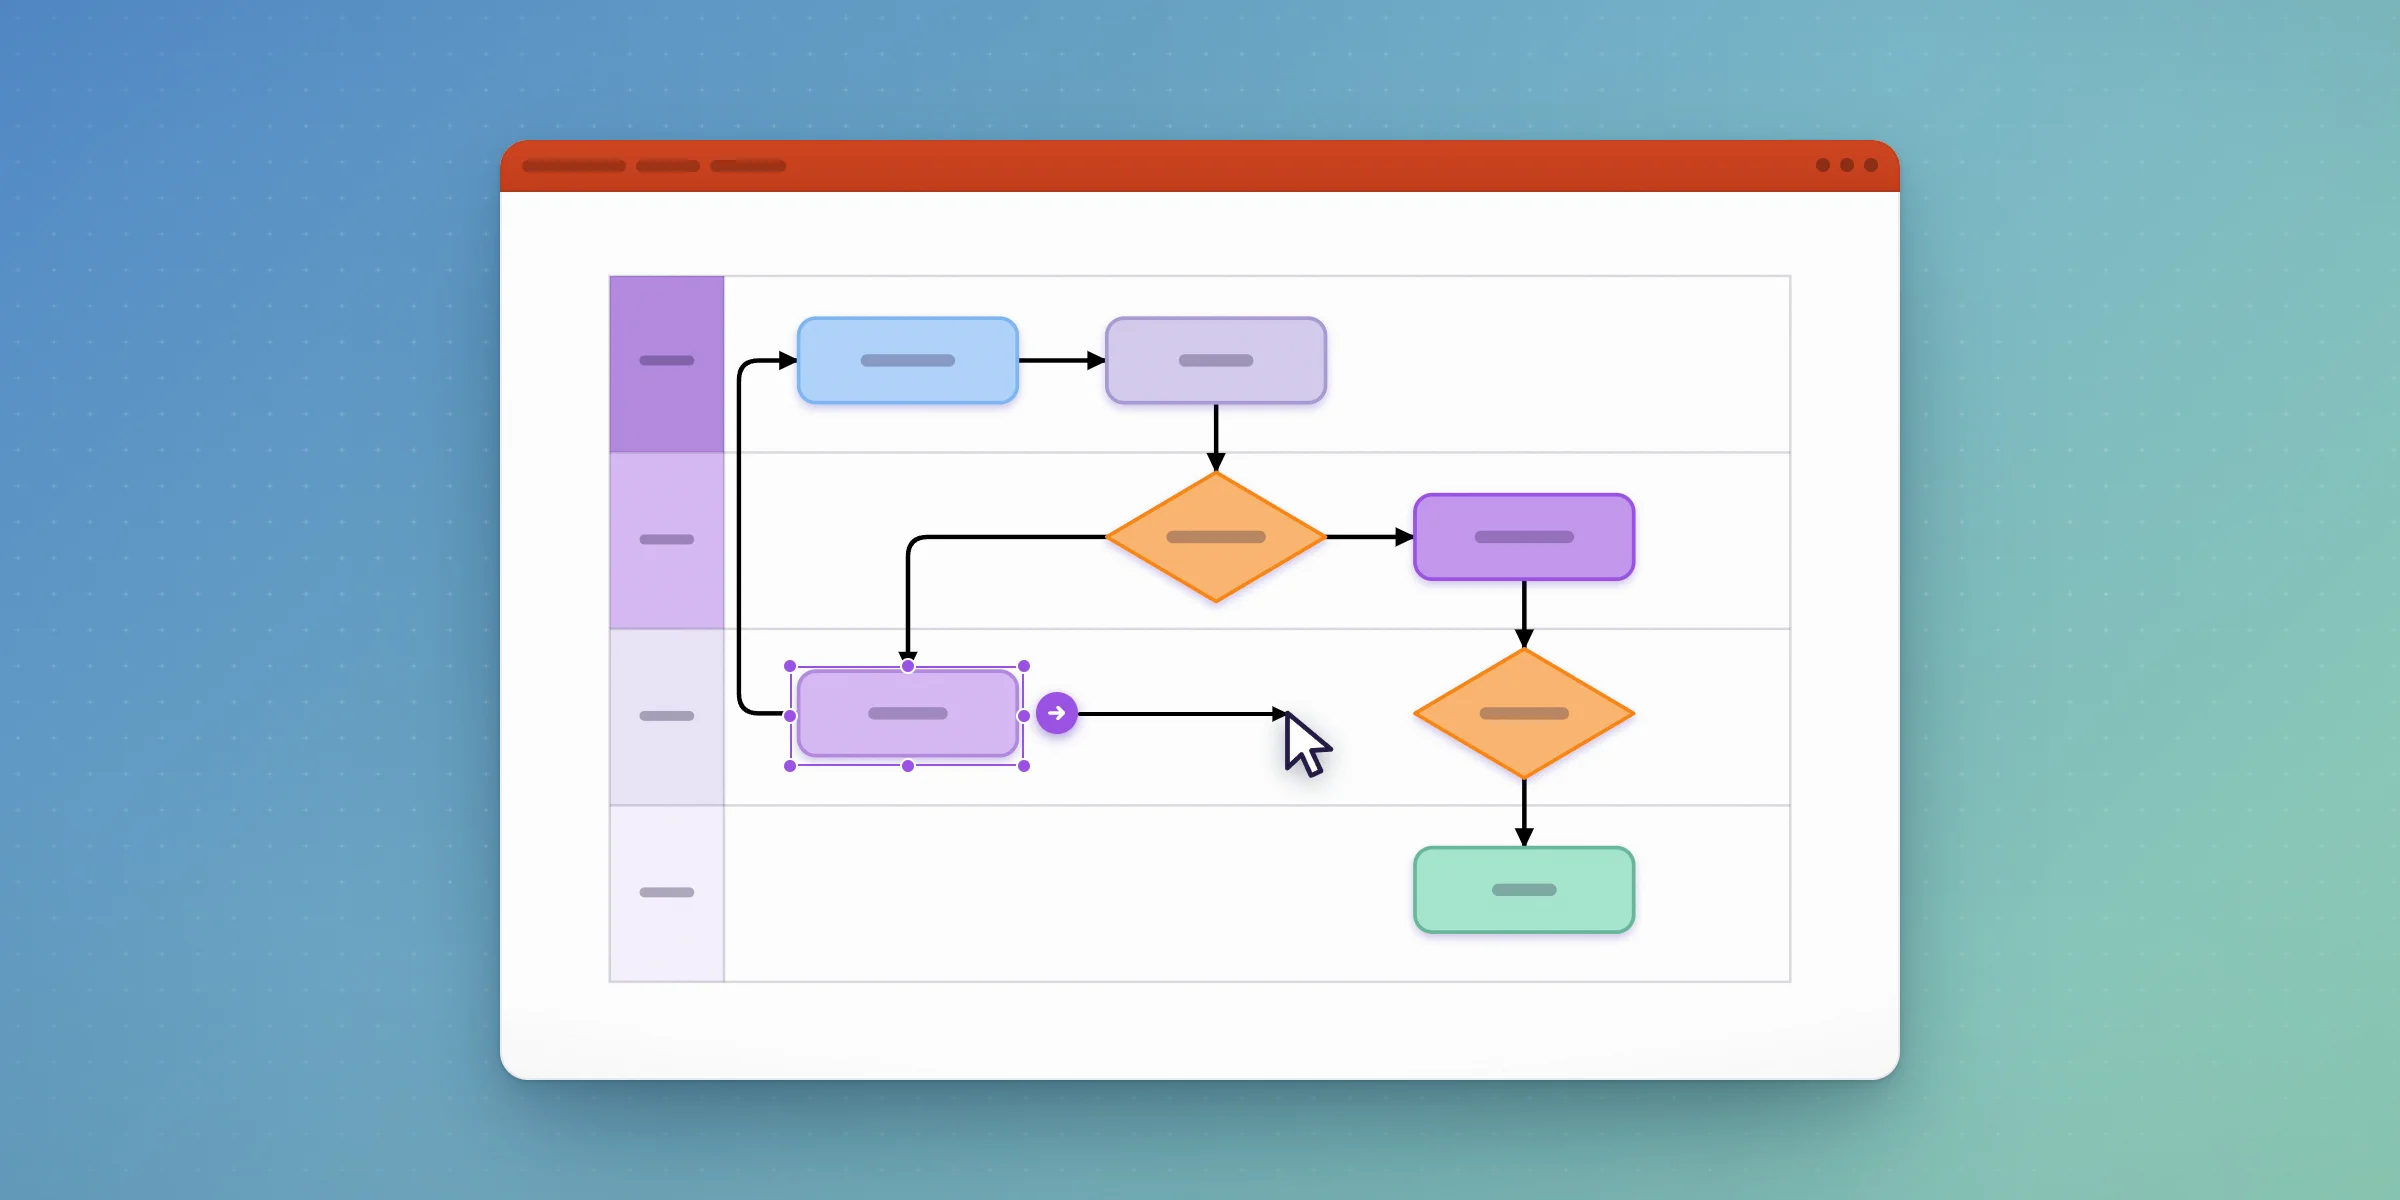
Work a real example: a launch approval workflow. Lay legal, marketing, and product in three swimlanes, add a decision diamond for "legal sign-off received?", and route the "no" branch to an escalation step. When the approver changes two weeks later, click the shape, retype the owner's name, and drag the connector to the new decision point. No export, no re-import, and no reformatting to fit the slide master, which is exactly the rebuild cycle that eats an afternoon when a diagram arrives as a flat PNG.
Present from the same file. Because every shape stays editable, you can update a step live in a steering committee meeting and send the deck out with the change already in it.
Step 3: Create a Gantt chart in PowerPoint with Lucen Timeline and Lucen Gantt templates

First, decide which view your audience needs. A timeline answers "what happens when" — sequence, phases, and milestone dates on a single track. A Gantt chart adds bars for task duration and links for dependencies, so a slipped date visibly pushes everything downstream. Steering committees usually want the timeline; delivery leads and PMO reviewers want the Gantt. Both come out of the same add-in.
Open Lucen Timeline from the PowerPoint ribbon, or use the browser version when you're not on your own machine. The outcome of this step is a native, editable chart on the slide you'll actually present, not a pasted screenshot.
Start from a template rather than a blank slide. The free Gantt chart template library includes a program management plan chart that summarizes timelines, requirements, resources, and risks; a project management plan chart aimed at mixed project and non-project audiences; a software development chart for tasks, milestones, and releases; a clinical trial chart covering Phase I–III; and an hourly chart for short tasks and status reporting. Pick the one whose default granularity matches your reporting cadence, a single choice that saves the most rework.
Next, import your data instead of typing it. Bring in an Excel schedule or sync from the project tool you already use, then refresh when the plan changes. That refresh step is the whole point for a launch plan or a recurring steering committee deck: dates, owners, and dependencies move weekly, and the slide updates rather than getting rebuilt.
Now tune the schedule view. Filter templates by the features that matter for the audience in the room: color-coded events, milestones, multiple timeline scales, percent complete, task duration, a today marker, swimlanes and sub-swimlanes, task dependencies, and planned vs. actual. For an executive read-out, a today marker plus percent complete usually does more work than added detail. For a program review, swimlanes by workstream plus dependency links show where the risk sits.
Lucen Timeline's tiers run Free, Lite, Plus, and Expert. In Timeline, swimlanes, dependencies, and Excel import sit in Plus, while planned vs. actual tracking, integrations, and other advanced capabilities sit in Expert.
Lucen Flowchart is priced separately and keeps it simple: Free (up to 10 shapes) and Plus at $9 a month billed yearly ($108 a year). Both plans include Lucen AI.
Step 4: Choose the right PowerPoint method for flowcharts, SmartArt, and Lucen add-ins
Match the method to the feature you actually need, then build once. Expected outcome: a diagram you can update next week without rebuilding it.
Start with what ships in PowerPoint. Insert > SmartArt gives you Process, Hierarchy, and Cycle layouts that auto-arrange as you type in the text pane, and Insert > Shapes gives you the flowchart shape set plus elbow and curved connectors that stay glued to shapes when you move them. Microsoft's own support documentation covers both routes. For a five-box approval flow or a single org chart on a one-off slide, this is the fastest path. It's already installed, needs no approval from IT, and costs nothing.
Where Visio fits. Visio is Microsoft's own diagramming tool. A basic version is included with commercial Microsoft 365 plans, Visio Plan 1 is $5 per user/month, and Plan 2 is $15 and adds the desktop app and advanced process diagrams (Microsoft). If your team needs a dedicated diagramming system, Visio is the standard choice. If the flowchart's job is to be presented and kept current in a deck, building it directly in PowerPoint saves the export-and-paste step.
The native route runs out of room when the diagram becomes a schedule. SmartArt has no concept of dates, task duration, dependencies, swimlanes, percent complete, or a planned versus actual comparison. Drawing those by hand means every date change turns into manual nudging of rectangles, and a screenshot pasted from an outside diagramming tool can't be edited at all on the slide.
That's the gap the add-ins close. Lucen Flowchart builds process flows, decision trees, and swimlane diagrams as native, editable shapes on the slide you present from, and it can draft a first version from a template or a short prompt to Lucen AI. Lucen Timeline handles the schedule side, including phases, milestones, and dependencies, with swimlanes and Excel import on the Plus plan and planned versus actual tracking on Expert.
Step 5: Keep the deck current when dates, owners, or process steps change
Edit the diagram in place instead of rebuilding it. When a process changes, such as a new approval gate, a step that moves from Legal to Procurement, or a decision branch that no longer applies, open the slide, select the shape, connector, or swimlane, and change it there. Lucen Flowchart keeps every element as a native, editable PowerPoint shape rather than a flattened image, so the slide stays presentation-ready the moment you finish. Many browser-first diagramming tools, Lucidchart among them, are built to author outside the deck and place the result on a slide; if you use one, confirm with the vendor whether the object round-trips as editable shapes or arrives as a picture, because that single detail decides whether the next update is a two-minute edit or a rebuild.
Adjust the schedule in the timeline view, then refresh the same slide. Change dates, reset a dependency, update percent complete, and let the visual redraw, with no re-formatting, no second version of the file. Lucen Timeline's Plus plan covers swimlanes, dependencies, and Excel import; Expert adds planned versus actual tracking, which is the feature-to-use-case match for anyone reporting variance rather than just intent.
Take a concrete case: security review sign-off slips from March 6 to March 20, pushing the pilot launch two weeks. In the next steering committee deck, the milestone marker moves, the dependent phase bar shifts with it, the planned bar stays visible under the actual, and the approval step in the process map gets a new escalation branch. Same file, same slide numbers, one edit pass.
That is the point of working this way. PMO reporting, client delivery plans, and launch decks all live or die on whether leadership is looking at this week's truth. The measurable win is less rework when scope, timing, or ownership moves, which they inevitably do.
Step 6: Use Lucen for management reporting, then check the limits before rollout
Match the feature to the use case before you standardize anything. The strongest fit is anyone who presents a process and a plan from the same deck: IT professionals walking stakeholders through decision trees and system flows, operations teams documenting SOPs and handoffs, consultants building client-ready visuals they will reuse across engagements, and program managers who keep a schedule slide and a process map side by side. If your reporting cycle already ends in a slide, keeping the shapes native removes the export-and-rebuild step that turns every diagram into a screenshot nobody can edit.
Point each tool at the work it was built for:
- Lucen Timeline: weekly executive updates, steering committee reviews, client delivery timelines, portfolio and PMO reporting, project kickoffs, board updates, and quarterly roadmap reviews. Swimlanes, dependencies, and Excel import sit in the Plus plan; planned vs. actual tracking and integrations sit in Expert.
- Lucen Flowchart: SOPs, onboarding workflows, approval and escalation workflows, decision trees, and cross-functional handoffs.
Before you roll it out, check three limits. Lucen Flowchart runs only in Windows desktop PowerPoint 2016 or newer, so Mac, web, and mobile users can edit finished decks but can't build new diagrams. The free plan caps each diagram at 10 shapes and three diagrams per account, and swimlanes need Plus. In Timeline, Excel import starts on Plus, while integrations with tools like Jira and Smartsheet sit in Expert.
Frequently asked questions
You enter or import task data, such as dates, phases, milestones, owners, and the add-in draws native PowerPoint shapes on the slide. The features that change your reporting week are dependencies, swimlanes, percent complete, a today marker, multiple timeline scales, and planned vs. actual comparison. Update the data, refresh, present.
SmartArt is free and already installed, and for a five-box linear process it is genuinely the faster answer. It gets painful when you add decision branches, swimlanes, and connectors that must survive weekly edits. Lucen Flowchart keeps the native-PowerPoint advantage and adds free-form connectors, decision paths, swimlanes, and auto layout.
Web-first diagramming tools are stronger for large shared shape libraries and real-time multi-author editing across an org. Check the current state of their PowerPoint integration directly with the vendor, including whether the inserted diagram stays editable on the slide or arrives as an image. That single question usually decides it for a PowerPoint-centric team.
Yes. Chronology work such as legal case timelines uses the same milestone and swimlane mechanics, and Lucen's Gantt template library filters by industry, including Legal.
Windows desktop PowerPoint 2016 or newer, including Microsoft 365. Flowchart is not available for PowerPoint on Mac, the web, or mobile, though anyone can open and edit the finished deck in PowerPoint without Lucen installed.
You can start free with up to 10 shapes. Plus is $9 a month billed yearly ($108 a year). Both plans include Lucen AI.
For simple flows, use SmartArt or shapes and connectors in PowerPoint. For a full diagramming tool, use Visio. To build process maps directly on the slide, Lucen Flowchart drafts the flowchart from a plain-language description using native, editable PowerPoint shapes. It supports swimlanes and decision paths, and auto layout keeps the diagram clean as steps change.
Use Visio when diagrams are a system of their own, managed by a team that lives in diagramming tools. Use a PowerPoint add-in when the flowchart's main job is to be presented and kept current in a deck, so there's no export, paste, or rebuild step.

Project management visualization: tips and tricks

Subscribe to our blog
Get all the tips, tricks and inspiration you need to create professional looking timelines, straight to your inbox.