Track time more effectively and turn your data into actionable insights. Lucen Track now integrates with Microsoft Power BI, making it easier to visualize, analyze, and report on how your team spends time.
Lucen Track already includes built-in reports, recaps, and progress charts designed to help teams better understand productivity and project performance. With the new Power BI integration, you can now take that analysis even further by transforming workspace data into advanced dashboards and visual reports.
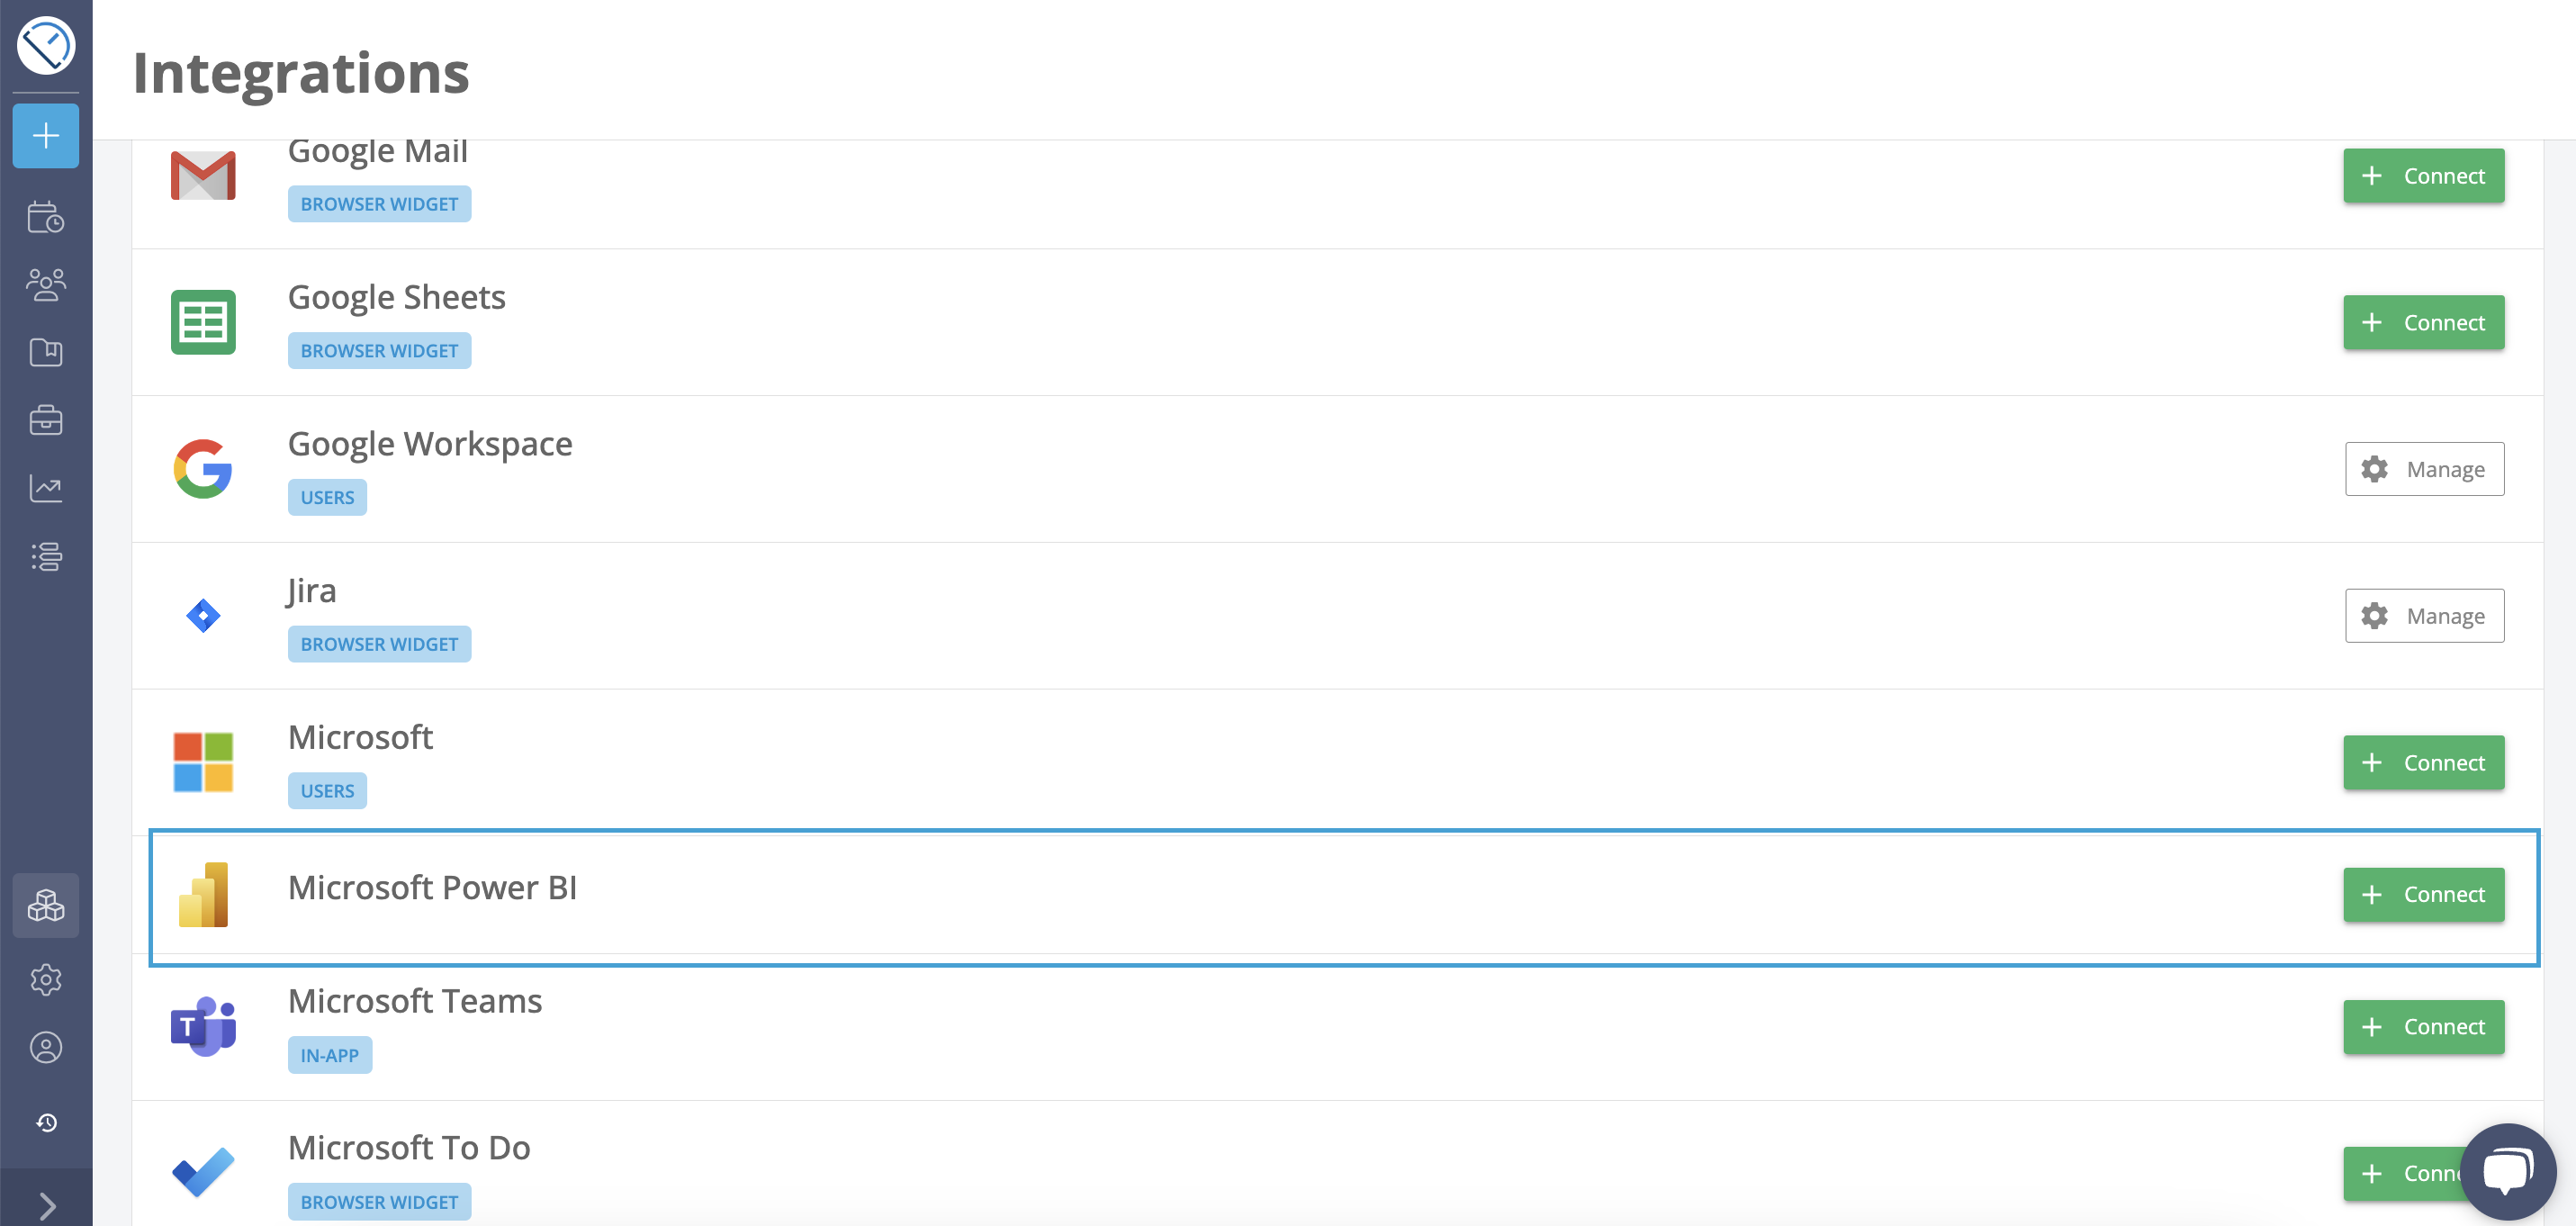
This update expands Lucen Track’s growing ecosystem of Microsoft integrations, which also includes:
How the integration works
With this integration, you can use your Lucen Track workspace as a data source directly inside Microsoft Power BI. Power BI supports a wide variety of data sources, including Excel, SQL Server, and numerous online services; and Lucen Track is now one of them.
This allows you to combine time tracking data with powerful business intelligence and reporting capabilities to create custom dashboards, productivity reports, and project performance visualizations.
Adding Lucen Track as a data source
To connect Lucen Track to Microsoft Power BI, simply download the connector file from the Integrations section of your workspace and save it to your computer.
We’ve also prepared a complete setup guide that walks you through the process step by step.
Once the connector is installed, you’ll be able to select Lucen Track as a data source directly within Microsoft Power BI and start building custom visual dashboards using your workspace data.
You can read the guide, but you will also find the steps explained on the integrations page as well.
After you have followed this procedure, you'll be able to select Lucen Track as a data source for creating visual dashboards on Power BI.
In Microsoft Power BI, click the "Get data" button, and then scroll down to find the "More "option.

In "Online services", you'll find Lucen Track:

Creating dashboards and visual reports
Once your data is connected, you can start building visual reports in Microsoft Power BI using your Lucen Track workspace data.
Power BI offers a wide range of visualization options, from classic bar and line charts to more advanced graphs, dashboards, and performance reports. The best visualization style will depend on the type of data you want to analyze and the insights you want to uncover.
For example, you can create reports that track project performance, monitor team productivity, analyze billable hours, or evaluate project profitability over time.
Below is an example of a Power BI report showing project profitability grouped by quarter:

Give this integration a try and let us know what you think!
Looking to track your time and create timesheets in other Microsoft Software? Don't miss out on the Lucen Track integration with Microsoft Teams.
Are you new to Lucen Track and just randomly found this article? Begin your journey with a free 14-day trial and dive into the world of time tracking, our extensive range of Microsoft integrations, and countless other exciting features.


Subscribe to our blog
Get all the tips, tricks and inspiration you need to create professional looking timelines, straight to your inbox.