


Microsoft 365 for Gantt Charts, Hours, and Flowcharts: What's Built In and What an Add-in Adds
What Microsoft 365 covers for Gantt charts, hour tracking, and flowcharts, and where Lucen Timeline, Track, and Flowchart add-ins fill the gaps.

The short answer
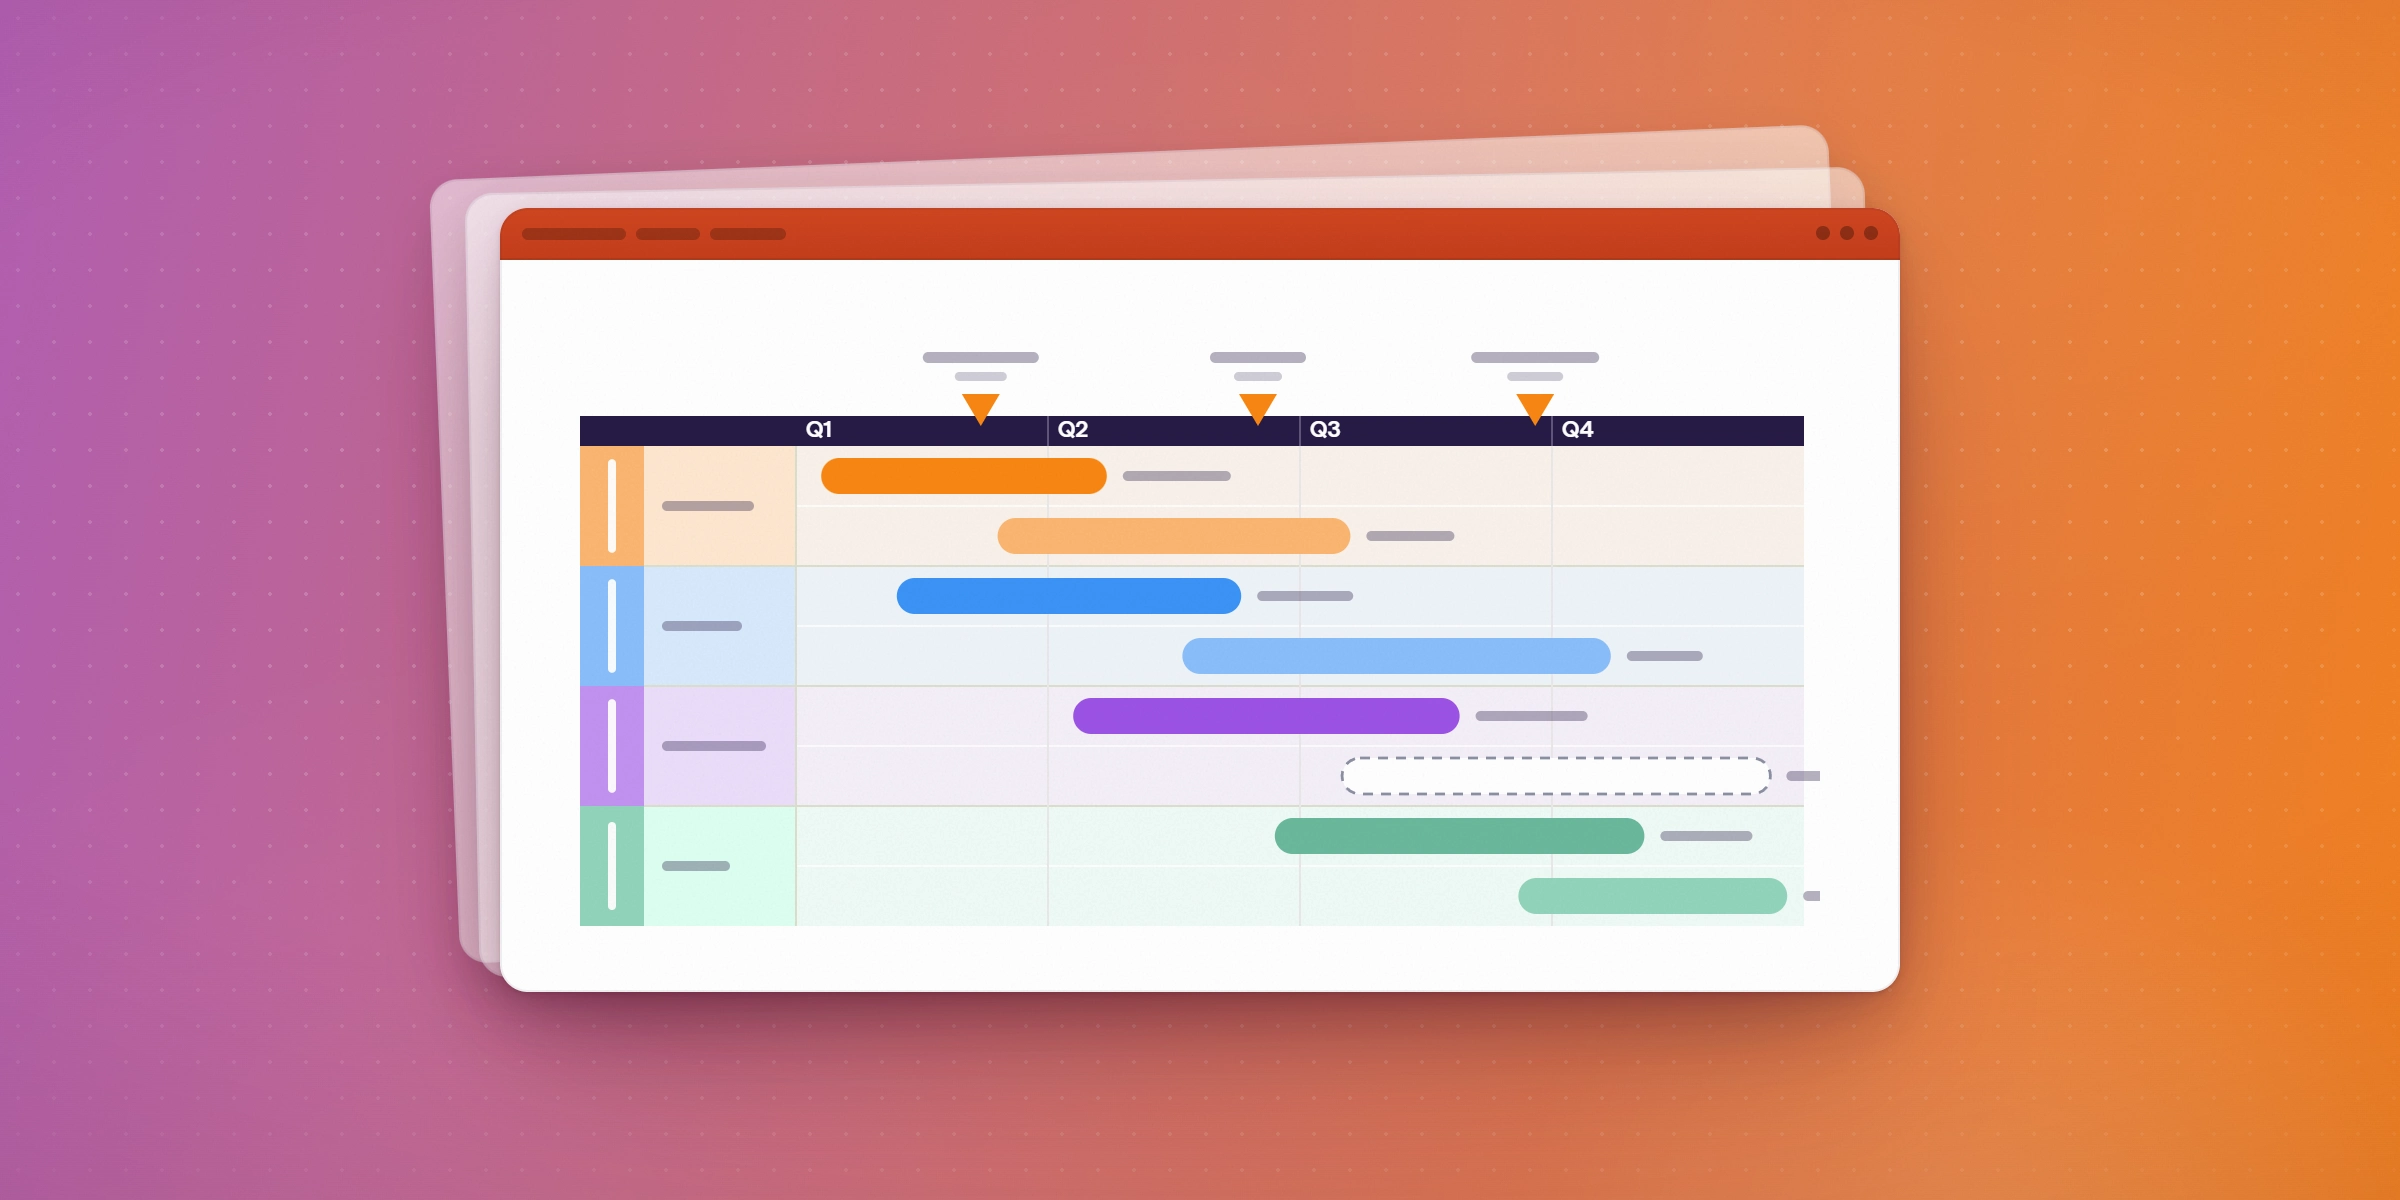
Microsoft 365 covers all three jobs in part. Gantt charts come from Planner, Microsoft Project, or a chart you build by hand in Excel or PowerPoint. Hours and costs come from Microsoft Project's resource rates and timesheets, or from a time tracking app that connects to Teams, Outlook, and Planner. Flowcharts come from Visio, or from shapes in PowerPoint. The gap is polish and upkeep: hand-built charts do not update, and the tools are separate. Lucen's three add-ins fill that gap inside the apps your team already uses: Timeline for Gantt charts in PowerPoint, Track for hours in Teams and Outlook, and Flowchart for process maps in PowerPoint.
How we compared them
For each of the three jobs we asked the same four questions.
- Is it built into Microsoft 365, or an add-on? And on which plan.
- Does it stay editable and current? What happens when a date, an hour entry, or a process step changes.
- Where does it live? Inside PowerPoint, Excel, Teams, and Outlook, or in a separate app.
- What does it cost? Prices as each vendor publishes them.
We read the vendors' own pages, so prices and claims are theirs, not an independent test. Pulled 1 Oct 2026.
Side-by-side comparison
Ten ways to cover Gantt charts, hours, and flowcharts in a Microsoft 365 environment. Prices and claims are the vendors' own, pulled 1 Oct 2026.
Gantt charts in Microsoft 365
Microsoft gives you three routes. Planner Plan 1 adds task dependencies and a Timeline (Gantt) view, and Microsoft Project adds Gantt and Timeline views plus custom fields for deeper schedules. For a chart on a slide, you can also build one by hand from a stacked bar chart in PowerPoint or Excel, or start from one of PowerPoint's Gantt templates.
The catch is the second update. A hand-built chart or a picture pasted from Planner or Project does not follow the plan when a date moves, so each reporting cycle means rebuilding or re-pasting.
Lucen Timeline works from the plan data instead. You import from Excel or Microsoft Project, pick a template, and create the Gantt chart inside PowerPoint, then refresh when dates change. Full Excel import, unlimited swimlanes, and dependencies with critical path start at the Plus plan, and the free plan is limited to 10 tasks or milestones. For step-by-step instructions, see how to make a Gantt chart in PowerPoint.
Tracking hours in Microsoft 365
Microsoft Project tracks cost by combining resource rates with task progress, and it compares actual cost against a baseline budget (Microsoft). That covers cost control for scheduled work. Project Professional also includes timesheets. For teams that want individuals to log hours day to day, many use an Excel timesheet, which works until someone forgets to update it.
A time tracking app that connects to Microsoft 365 removes that step. Lucen Track (formerly Timeneye) has a Teams app, an Outlook add-in that turns calendar appointments into time entries, time entry on Planner task cards, Azure DevOps work items, and a Power BI connector for dashboards. It supports billable and non-billable tracking and project profitability views. Pricing starts from $7/month. See also our guide to the top time tracking tools for Microsoft 365.
One way to split the work: use Project or Planner for the schedule and budget, and a tracking app for the hours that feed it.
Flowcharts in Microsoft 365
Visio is Microsoft's own flowchart tool. A basic version is included with commercial Microsoft 365 plans with limited templates, Visio Plan 1 is $5 per user/month, and Visio Plan 2 is $15 and adds the desktop app and advanced process diagrams (Microsoft). It works with Teams, PowerPoint slide snippets, and Excel's Data Visualizer. If the team needs a diagramming system, Visio is the standard choice.
For a flowchart that lives on a slide, many teams draw shapes and connectors by hand in PowerPoint. That is free, but spacing and connectors are adjusted manually whenever a step changes.
Lucen Flowchart is a PowerPoint add-in that keeps every shape a native, editable PowerPoint object. You describe a process and it drafts the flowchart on the slide, with swimlanes and auto layout that reroutes connectors when steps change. It runs on Windows with PowerPoint 2016 and newer.
How to choose
Pick by job, then by how often the content changes.
- A Gantt chart for a one-off meeting. PowerPoint's templates or a stacked bar chart are enough.
- A Gantt chart that feeds a recurring update. Use an add-in that imports the plan and refreshes, such as Lucen Timeline.
- A schedule and budget the whole team works in. Use Planner or Microsoft Project, and add a slide tool for leadership.
- Hours logged by individuals. Use a time tracking app that connects to Teams, Outlook, and Planner, such as Lucen Track, instead of a spreadsheet.
- A formal diagramming system. Use Visio.
- A process map inside a deck. Use PowerPoint shapes for a quick sketch, or Lucen Flowchart when the process changes often.
The three Lucen products share one idea: the work stays in the Microsoft app where the team already is.
Frequently asked questions
Start with the built-in routes: Planner Plan 1 or Microsoft Project for the plan, and a hand-built stacked bar chart or a PowerPoint template for the slide. For a chart that refreshes from your data, add-ins such as Lucen Timeline and think-cell build the Gantt chart inside PowerPoint.
You can format a stacked bar chart by hand or start from a PowerPoint Gantt template. Both work for one chart and slow down when dates change. With Lucen Timeline you import tasks from Excel or Microsoft Project, choose a template, and create the Gantt chart or roadmap on the slide.
Draw shapes and connectors by hand, or use Visio for a full diagramming tool. Lucen Flowchart is a PowerPoint add-in that drafts a flowchart from a description using native, editable shapes, with swimlanes and auto layout.
Microsoft Project tracks costs from resource rates and task progress against a baseline. Lucen Track adds time entry inside Teams, Outlook, and Planner, with billable and non-billable tracking and a Power BI connector for reporting.
Use Microsoft Project for cost against a baseline, and a connected time tracking app for the hours. Lucen Track logs time from the Teams app, Outlook calendar entries, and Planner task cards.
Planner Plan 1 and Microsoft Project include Gantt-style Timeline views. Excel has no built-in Gantt chart type, and PowerPoint offers Gantt templates under File > New. Either way the chart is a static object, so keeping it current means editing it by hand or using an add-in.
Project management visualization: tips and tricks

Subscribe to our blog
Get all the tips, tricks and inspiration you need to create professional looking timelines, straight to your inbox.