
Simple flowchart template
Five shapes and one decision branch: A start, two steps, a revision path, and an end. The fastest way to map a process you have not drawn before.



Six stages: awareness, consideration, decision, purchase, onboarding, and advocacy. Laid out as a linear lifecycle with a milestone icon at every step.
Powered by Lucen Flowchart
A customer journey map is a linear diagram that shows every stage a customer moves through, from first hearing about you to recommending you, in the order they experience it.
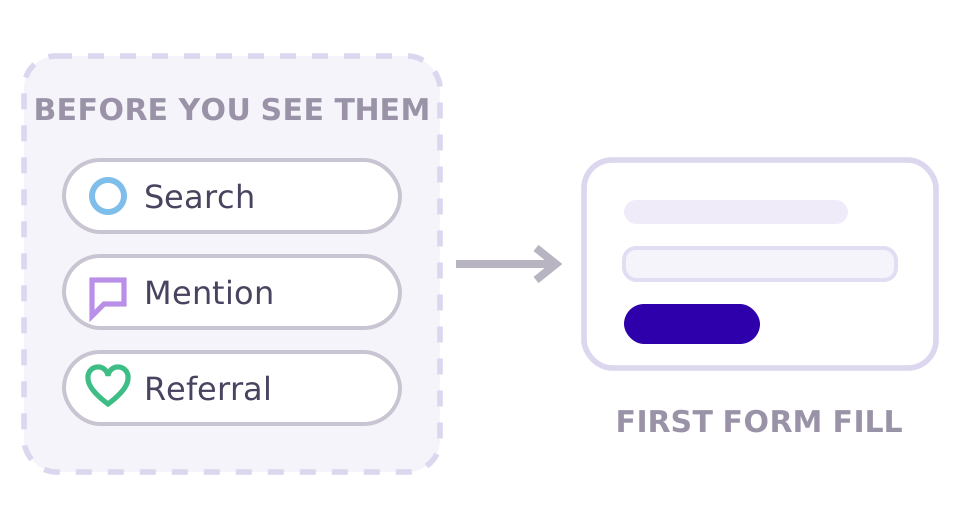
Awareness happens somewhere you are not watching. A search, a mention, a colleague's recommendation. The map starts there rather than at the first form fill, because everything a customer decides before contacting you shapes what they expect when they do.
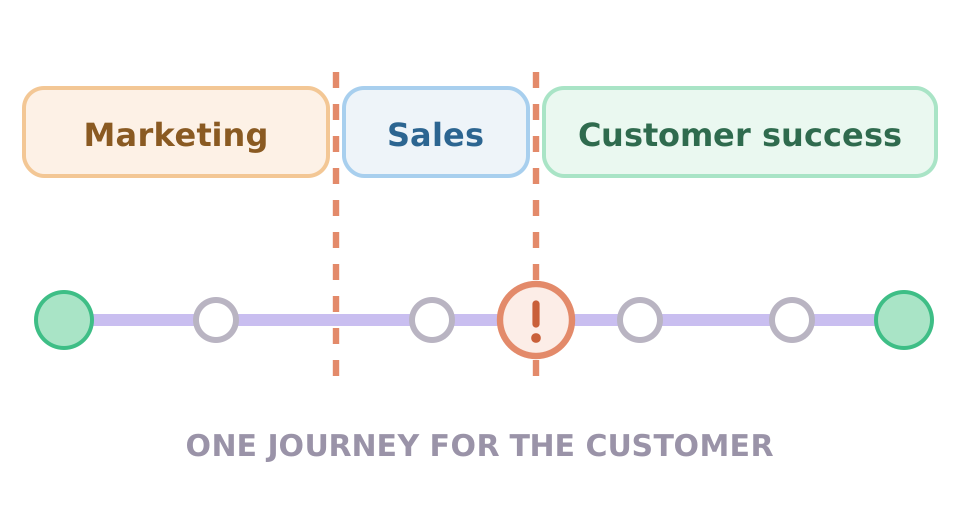
The stages are continuous for the customer and divided for you. Marketing owns two, sales owns one, customer success owns the rest. A single map makes those seams visible, so the handover from purchase to onboarding is designed rather than assumed.

A diagram survives a planning session in a way a funnel report does not. That is why marketing and CS teams keep the journey map as the shared reference rather than a slide decoration, and why it belongs in the deck, not in a research file.
Templates are grouped by the team that uses them. Open Sales & Customer, pick the customer journey map, and it opens on a PowerPoint slide as native, editable shapes.
Six stage shapes, five connectors, and a milestone icon on every stage all native PowerPoint objects on a single 16:9 slide, built with Lucen Flowchart.
STAGE 01
The entry point, drawn as a terminator rather than a process step because it happens to you rather than being something you run.
STAGE 02
The evaluation middle, where the customer compares options and commits. Two stages rather than one, because the shortlist and the choice are different moments with different content needs.
STAGE 03
The transition from prospect to customer. These two sit adjacent for a reason: it is the seam where most companies hand over between teams, and where most journeys lose momentum.
STAGE 04
The end state, and the only one that feeds back into the beginning. Change the stage names and Auto Layout reflows the chain with them.
Download the .pptx and drop it into your deck. Every shape is a native PowerPoint object, so you can edit it with PowerPoint's own tools — and with Lucen Flowchart installed, connectors reroute and the diagram reflows as you move things.
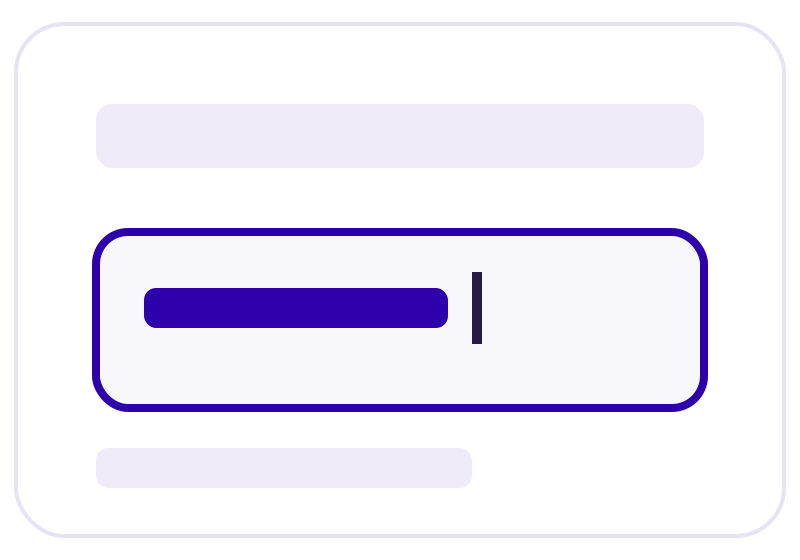
Click any step and type to replace the text. Font, fill, and size follow your deck theme.
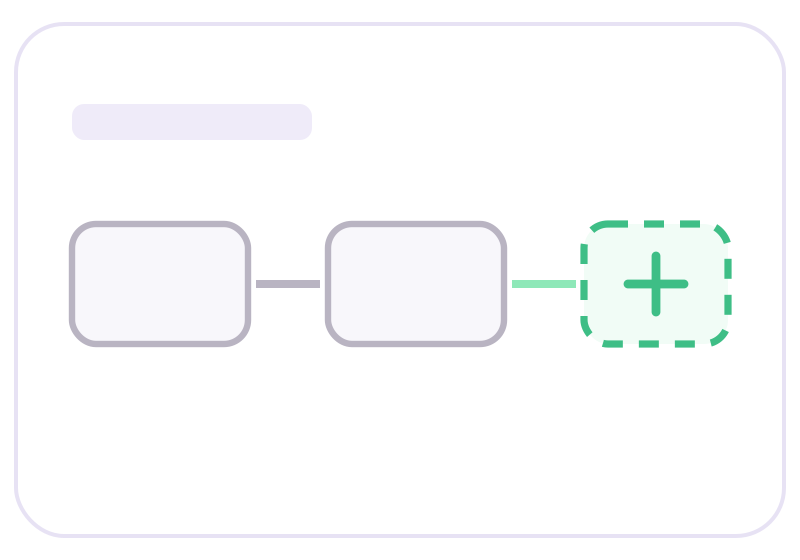
Copy a shape into the flow, or delete one you don't need.

Change the deck theme and the flowchart follows. Override individual shape colors when a step or lane needs to stand out.
Teams use it as a shared reference for marketing and customer success, a stakeholder slide in a go-to-market or board deck, a training reference for anyone new to a revenue team, and a starting point for any lifecycle map — user onboarding, renewals, or partner journeys.
If your process differs from the template, describe it instead of redrawing it. Lucen AI generates the diagram as native, editable shapes on the current slide, then keeps editing it in place rather than regenerating from scratch.
1. Open Lucen AI with Generate with AI — On the Lucen Flowchart tab, choose Generate with AI. The Lucen AI pane opens beside the slide — describe the change you need, or attach an image of a diagram you already have.
2. Answer the clarifying questions — If the prompt is broad, Lucen AI asks about the audience and depth before generating.
3. Refine it on the slide — Ask for a sub-swimlane or a new branch, or edit the shapes directly. The diagram stays the same object throughout.
If your process already exists as a screenshot or a photo of a whiteboard, give the image to Lucen AI instead of redrawing it. It reads the steps, decisions, and any lanes, then rebuilds the same flowchart on your slide as native PowerPoint shapes, which you then edit like any other object — rename a step, add a branch, or ask for another lane.
This template uses six: awareness, consideration, decision, purchase, onboarding, and advocacy. Awareness is first contact with the brand, consideration is active evaluation, decision is the commitment to buy, purchase is the transaction itself, onboarding is reaching first value, and advocacy is recommending you to someone else.
Some models compress this to three stages and some expand it to nine. Six is the version most cross-functional teams can agree on without argument, which matters more than theoretical completeness.
Start from what the customer does, not from what your teams do. We recommend following this process:
Because a map is not a simulation. Real customers skip stages, go backwards, and re-enter months later, but a diagram that tries to draw every possible path becomes unreadable, and an unreadable map does not get used.
The linear version is a shared reference for what the intended journey looks like, which is what you need when four teams are arguing about who owns onboarding. If you need the loops, add them as branches once the straight line is agreed.
A journey map is drawn from the customer's point of view; a sales process flowchart is drawn from yours. The difference matters in practice:
Most teams keep both, and join them at the purchase stage. The sales process flowchart template covers the internal half.
A journey map follows one customer through the stages of a relationship with one company. An experience map is broader — it looks at how someone solves a problem generally, including the parts where your product is not involved at all.
Use a journey map when you are improving your own funnel. Use an experience map when you are trying to find out what else the customer is doing that you have not thought about.
Because a customer who buys once and never mentions you is a worse outcome than one who buys once and brings two more. Ending the map at purchase treats the transaction as the goal, which is how companies end up with a strong funnel and weak retention.
Advocacy also feeds back into awareness for someone else, which is the only stage on the map that generates new entries to it. That is worth making explicit to whoever owns the marketing budget.
Every stage should have a named owner, and the handovers between them are where journeys break. A common split:
If two teams both think they own a stage, or neither does, that is the stage to fix first.
PowerPoint can do it with SmartArt, but the layouts are fixed: you get a preset chevron or process graphic that cannot be extended without breaking its spacing, and adding a stage reflows everything you already positioned.
A faster route is the Lucen Flowchart tab, which snaps connectors to shape anchors and reflows the chain with Auto Layout when you insert a stage. Either way, the result stays a set of native PowerPoint objects on your slide.
The download is a free .pptx made of native PowerPoint shapes, so anyone can open, read, and edit it, and you can share it as you would any deck; recipients need nothing installed.
The smart connectors, Auto Layout, and Lucen AI come from the Lucen Flowchart add-in, which adds a Lucen Flowchart tab to the ribbon and runs on Windows with PowerPoint 2016 or later and with PowerPoint for Microsoft 365. PowerPoint for the web, Mac, and mobile are not supported. Setup and troubleshooting steps are in Lucen Support.
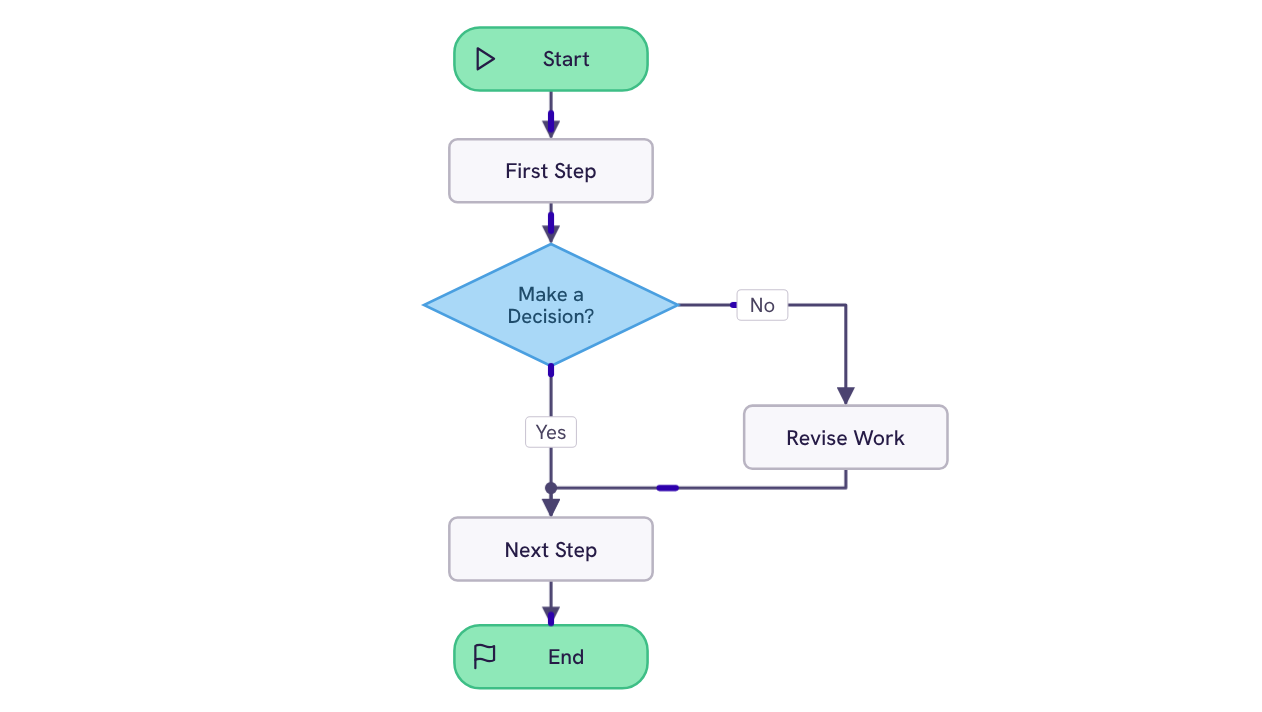
Five shapes and one decision branch: A start, two steps, a revision path, and an end. The fastest way to map a process you have not drawn before.
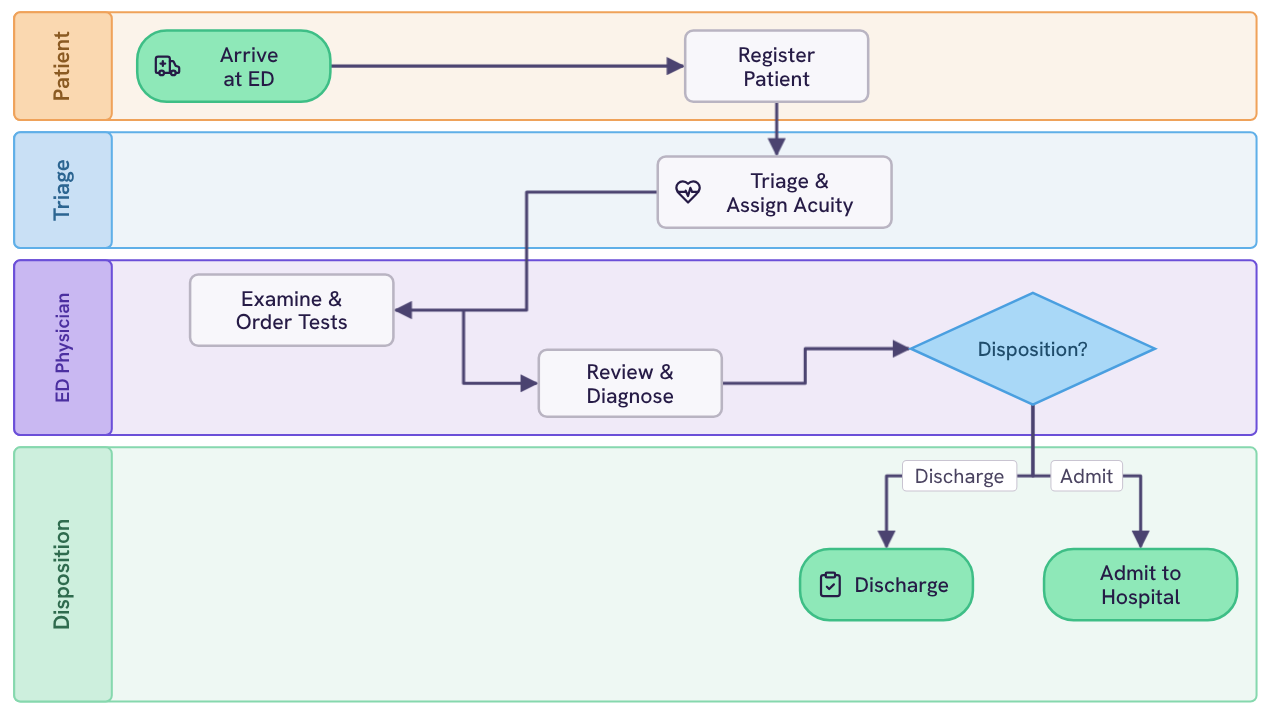
Four lanes: patient, triage, ED physician, and disposition. Routing a visit from arrival through acuity assessment and examination to admission or discharge.
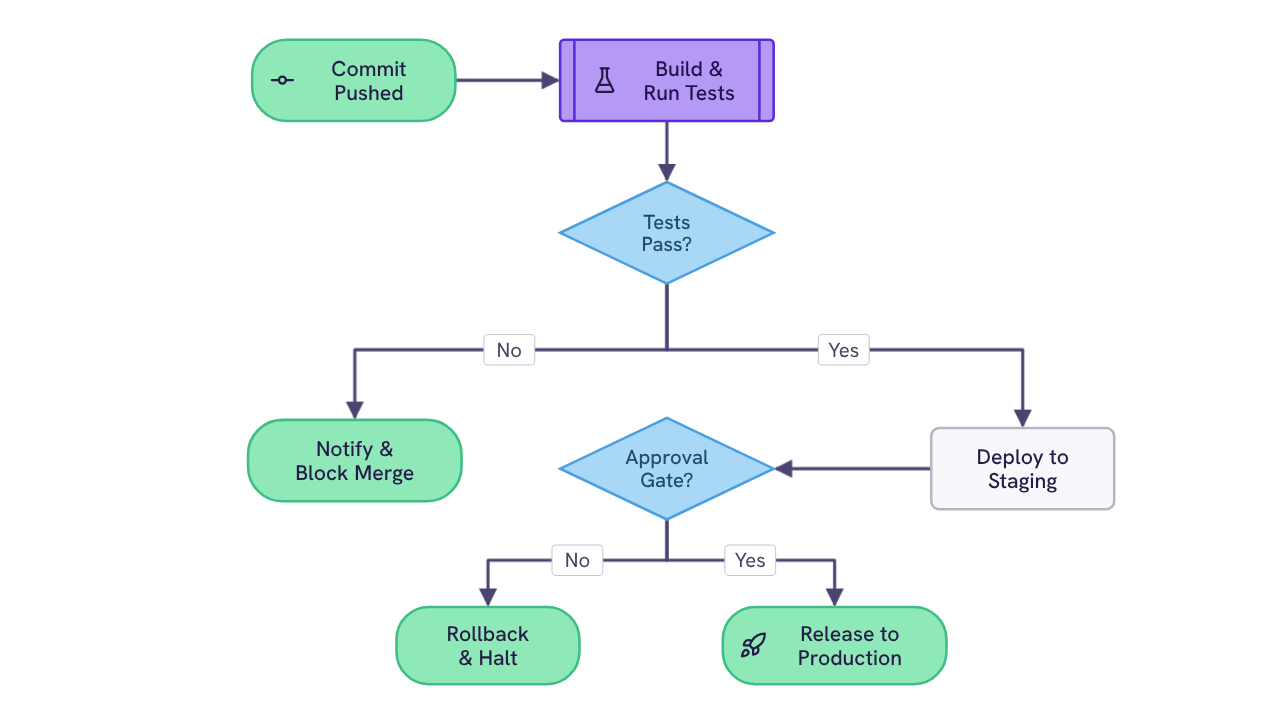
Two gates: automated tests and a human approval. Routing every commit to production, a blocked merge, or a rollback.
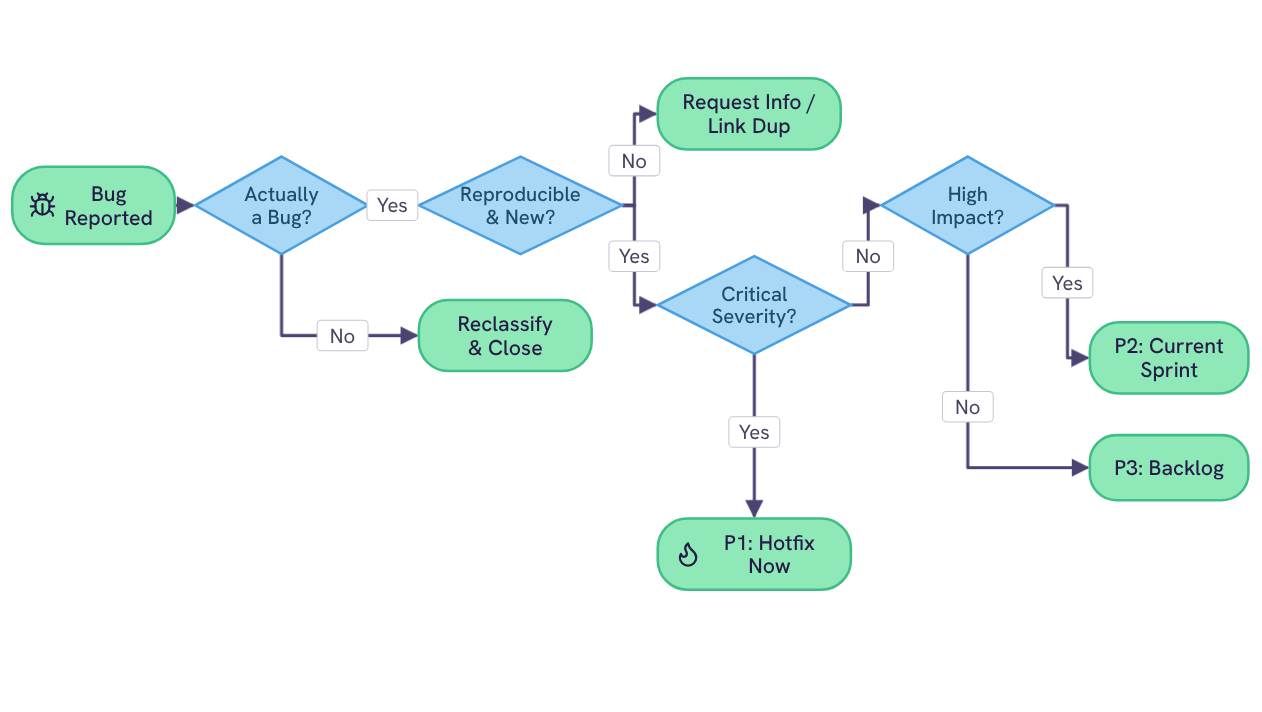
Four decision points: validity, reproducibility, severity, and impact. Routing every reported bug to one of five outcomes, from hotfix now to backlog.
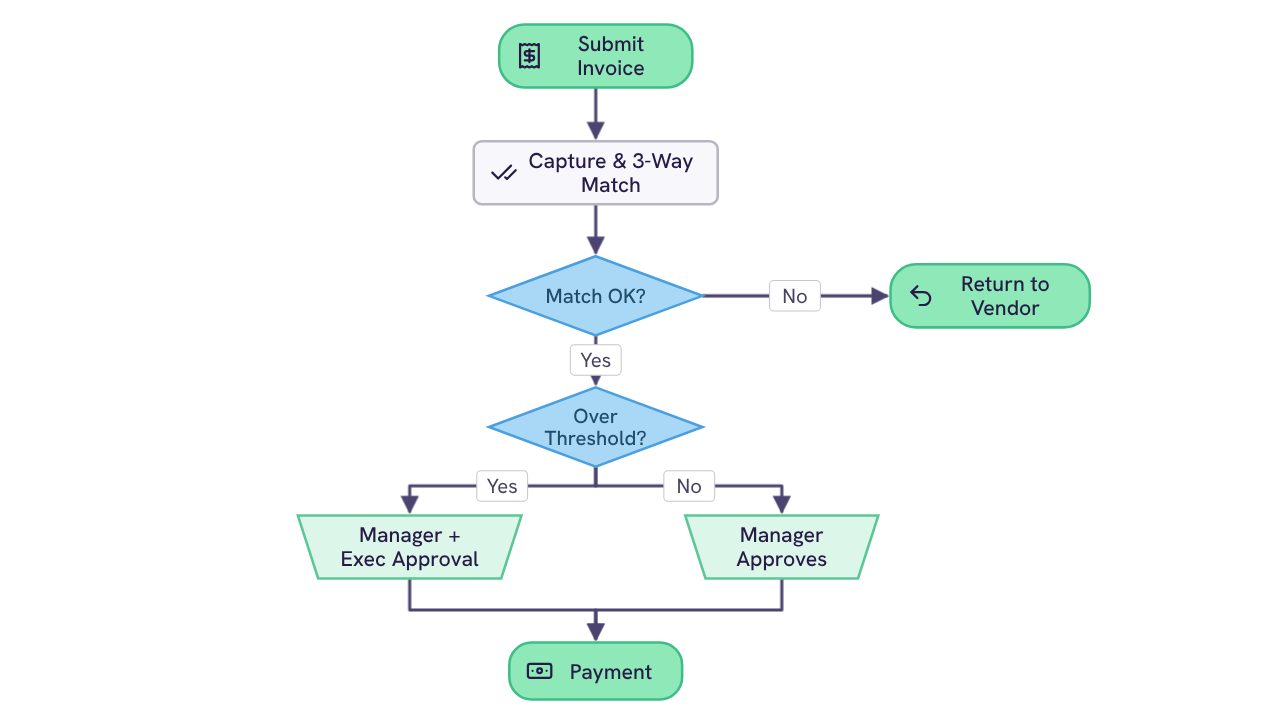
Two decision points: the three-way match and the value threshold. Routing an invoice from submission through the right level of approval to payment, or back to the vendor.
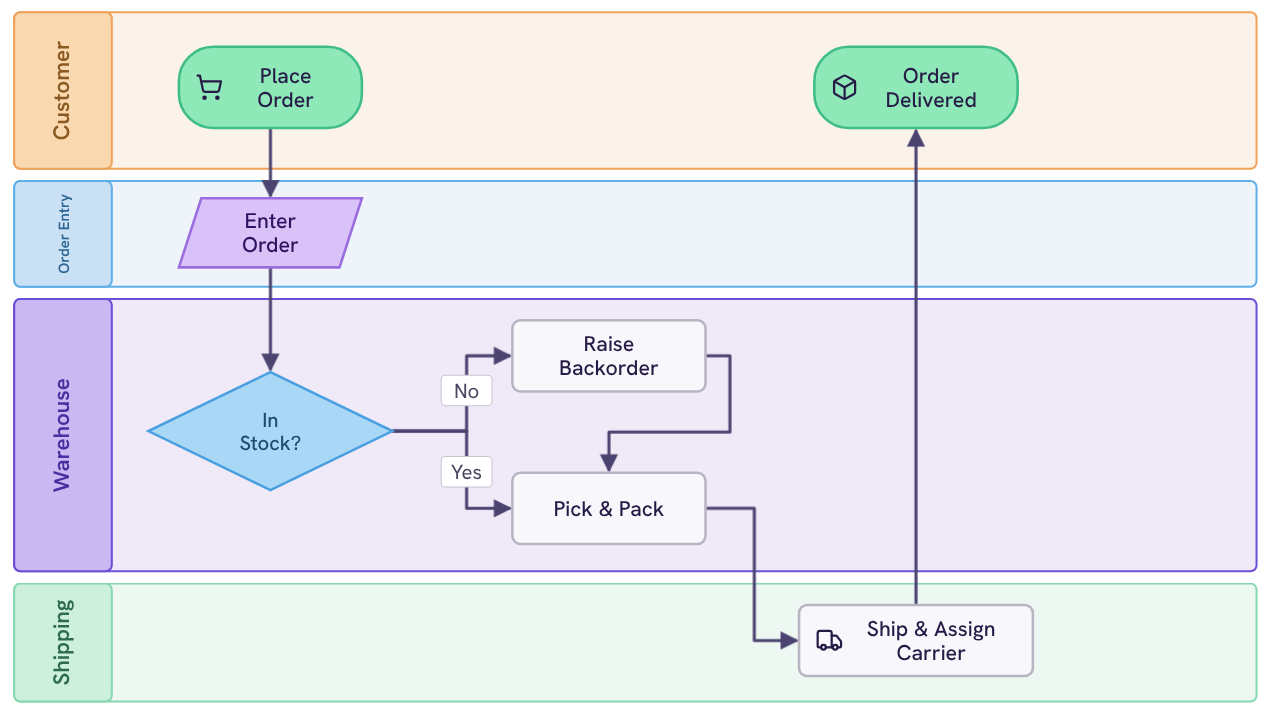
Four lanes: customer, order entry, warehouse, and shipping. Routing an order from placement through a stock check and picking to dispatch and confirmed delivery.
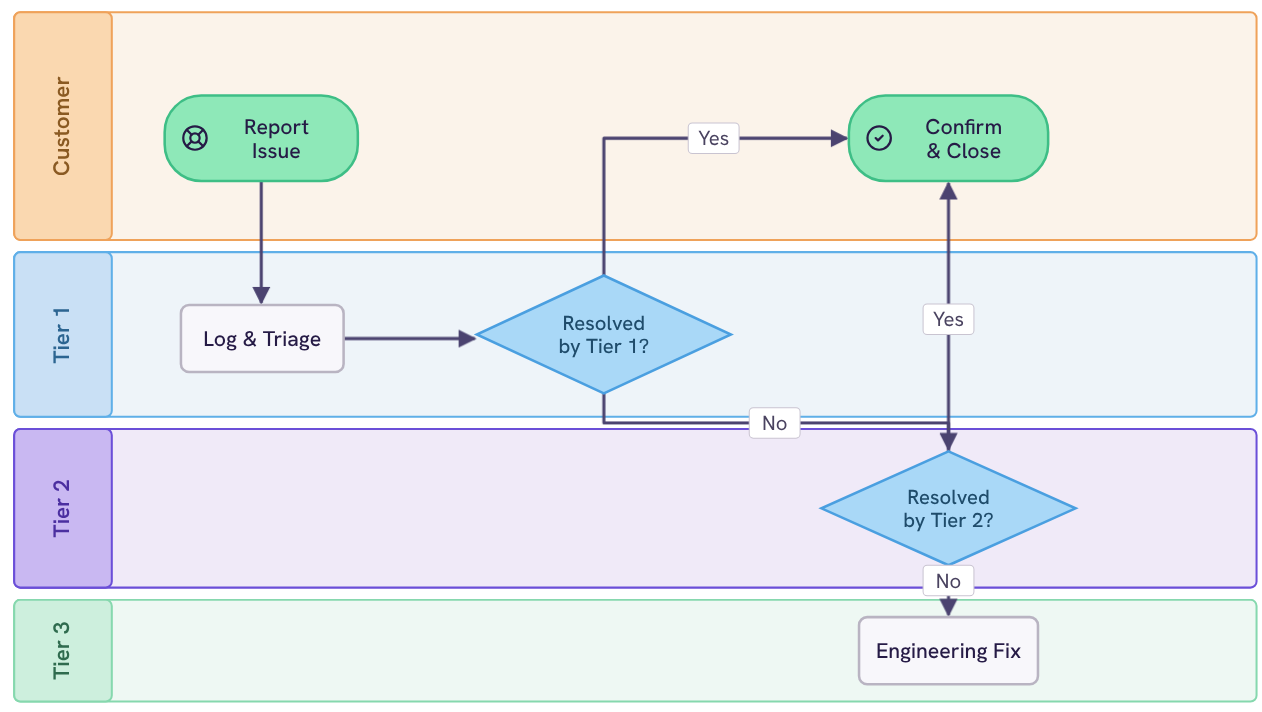
Four lanes: customer, Tier 1, Tier 2, and Tier 3. Routing an issue from first report through two resolution gates to engineering or a confirmed close.
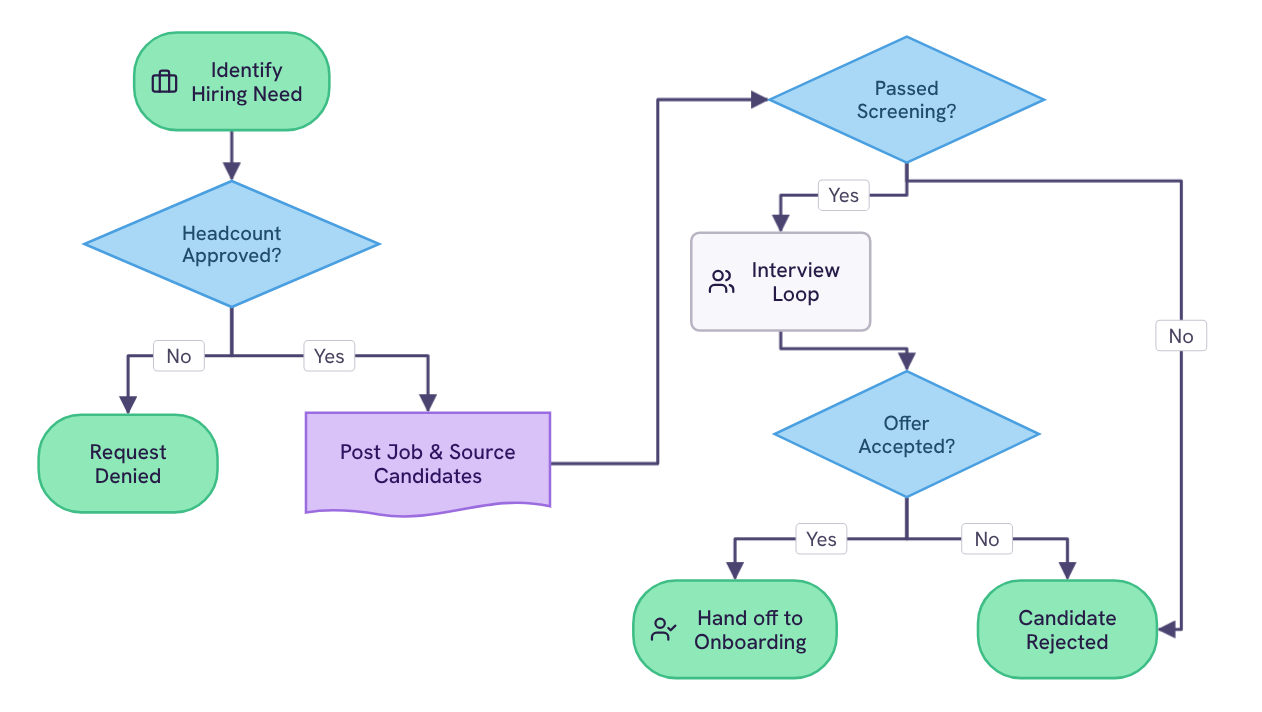
Three decision points: headcount approval, screening, and the offer. Routing a role from an identified need through sourcing and interviews to the onboarding handoff.
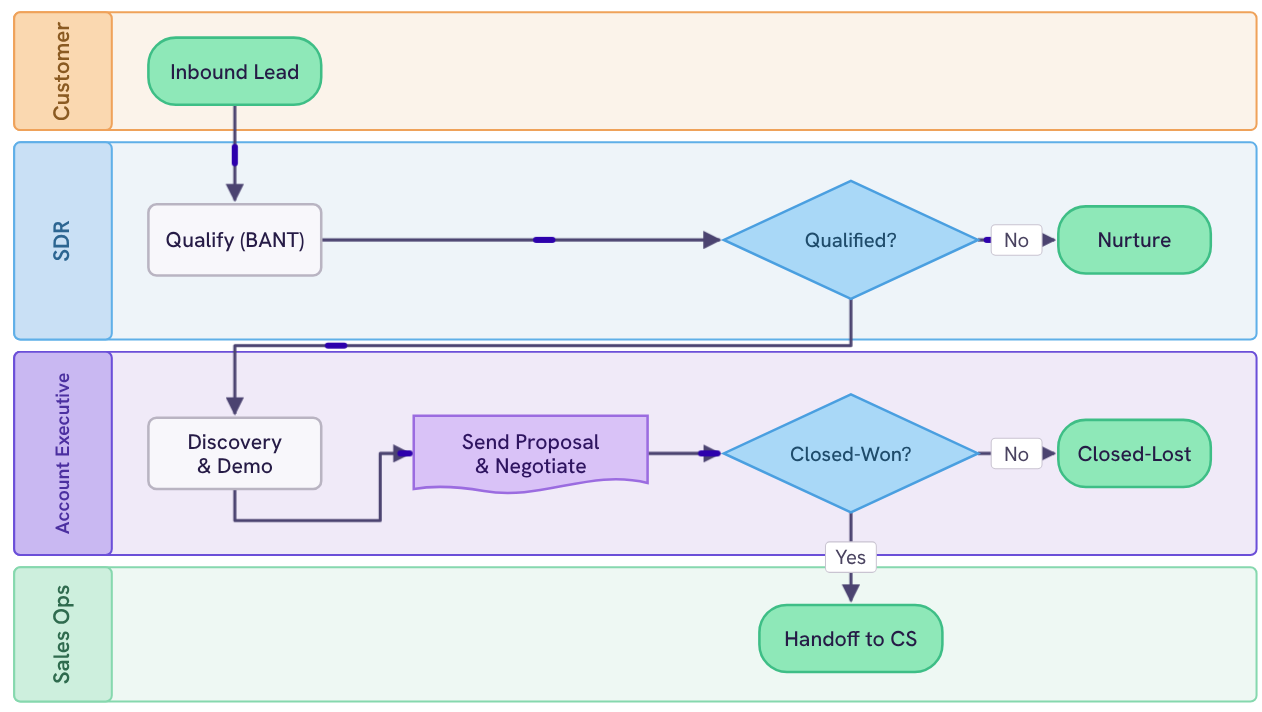
Four lanes: customer, SDR, account executive, and sales ops. Covering the inbound lead, BANT qualification, discovery, proposal, and the handoff to customer success.
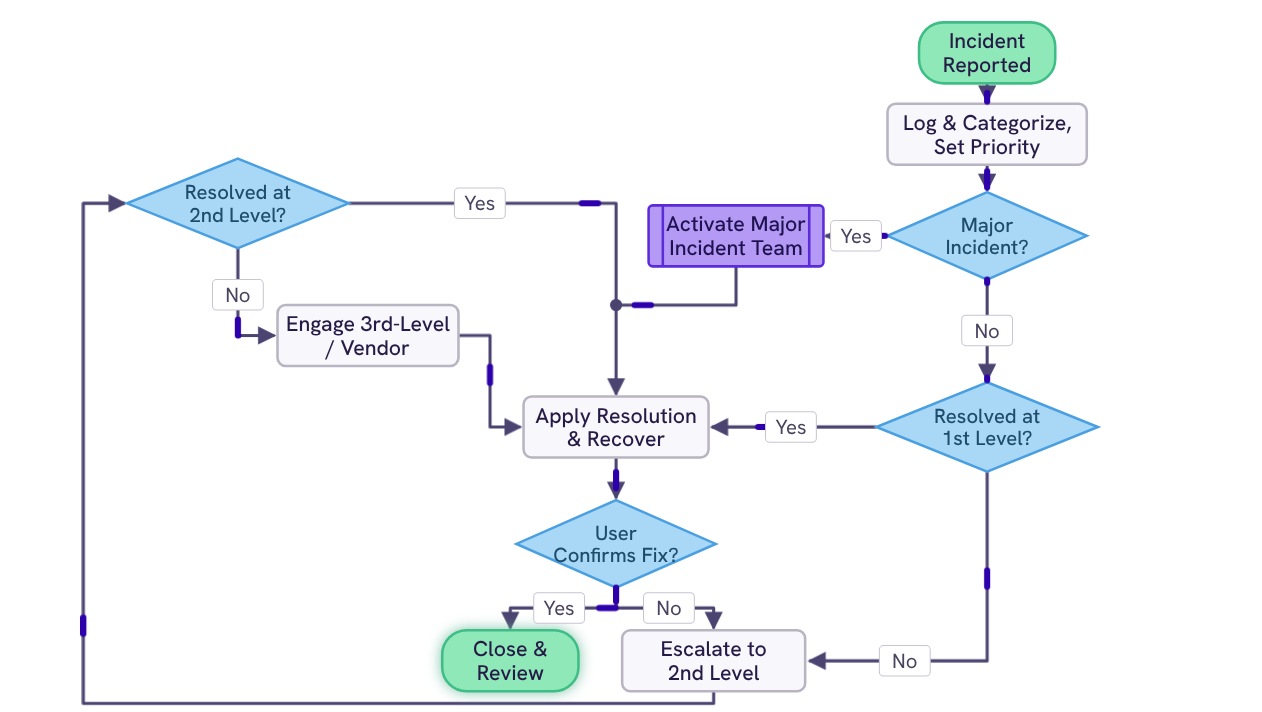
Four decision points: major incident, first level, second level, and user confirmation, routing an incident from first report through tiered escalation to close and review.
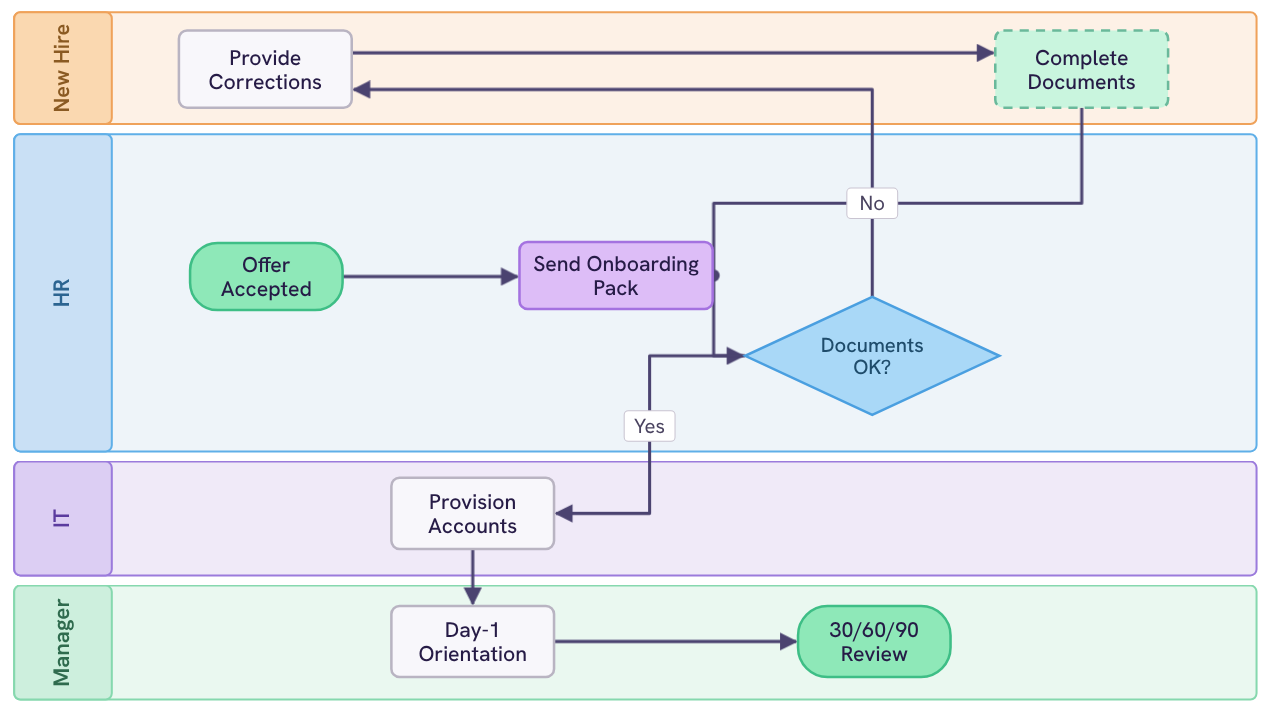
Four lanes — new hire, HR, IT, and manager — covering the offer, documents, provisioning, day-1 orientation, and the 30/60/90 review.

Free .pptx, editable in PowerPoint, no diagramming tool required.

Your download should start now. If it doesn’t start click here and check your inbox for tips to get started.