
Simple flowchart template
Five shapes and one decision branch: A start, two steps, a revision path, and an end. The fastest way to map a process you have not drawn before.



Four lanes: patient, triage, ED physician, and disposition. Routing a visit from arrival through acuity assessment and examination to admission or discharge.
Powered by Lucen Flowchart
An emergency department patient flow chart is a swimlane diagram that shows every step of a visit between arrival and disposition, with each lane assigned to the team that owns it.
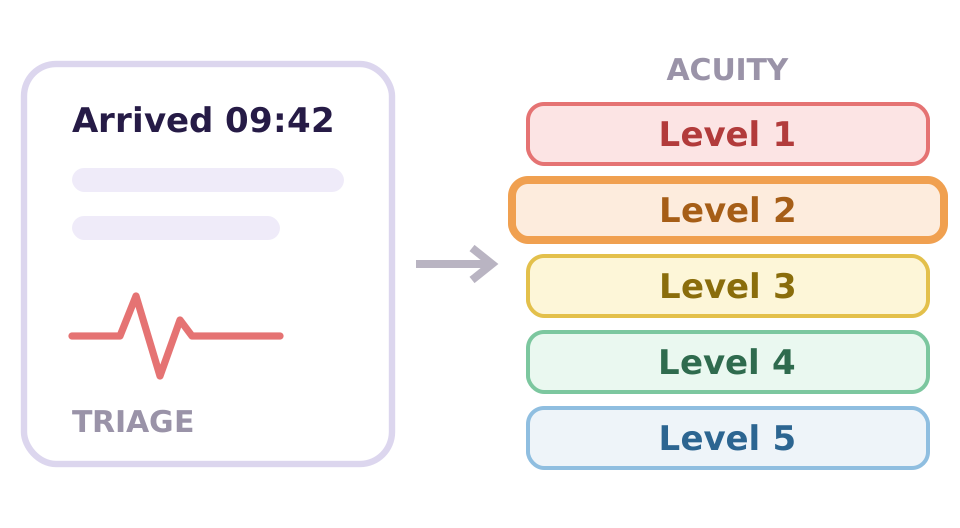
A patient arrives, and within minutes a triage assessment determines how the rest of the visit runs. The flow chart puts every stage in one frame: registration, triage, examination, disposition. So the sequence is visible to clinical and administrative staff alike.
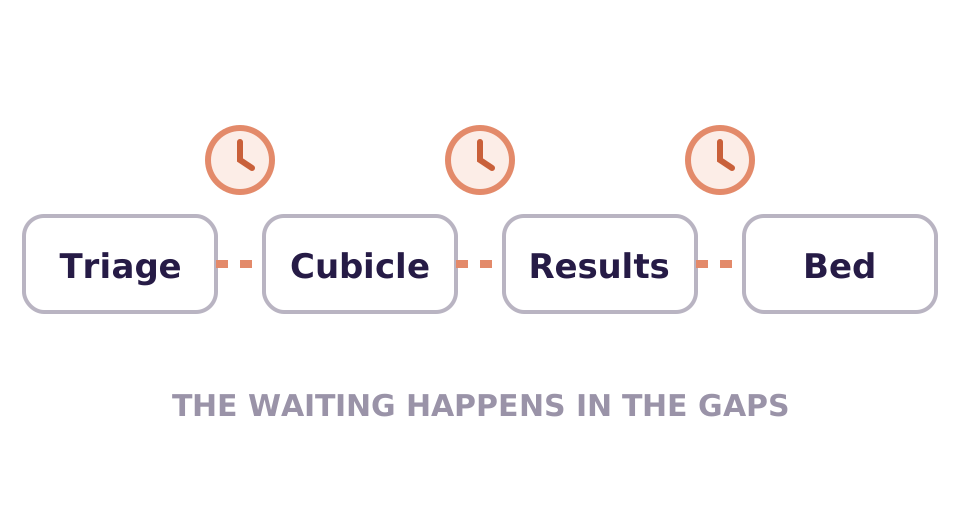
Examination and diagnosis take the time they take. The waiting happens in the gaps: between triage and a cubicle, between tests ordered and results returned, between a decision to admit and a bed becoming free. A swimlane makes those handovers visible.

A diagram survives a capacity review in a way a written policy does not. That is why ED and operations teams keep the flow chart as the process of record rather than a slide decoration and why it belongs in the deck, not in a binder.
Templates are grouped by the team that uses them. Open Healthcare & General, pick the emergency department patient flow chart, and it opens on a PowerPoint slide as native, editable shapes.
Seven process shapes, one decision node with two named exits, four labelled lanes, and the connectors that join them all are native PowerPoint objects on a single 16:9 slide, built with Lucen Flowchart.
LANE 01
Arrival and registration. The visit starts in the patient's own lane, which keeps the diagram anchored to their experience rather than to departmental process.
LANE 02
Assessment and acuity assignment. A single step carrying disproportionate weight, because everything downstream is sequenced by the score set here.
LANE 03
Examination, test ordering, review, and diagnosis, ending at the disposition decision. The longest lane on the diagram, and where most of the clinical time is spent.
LANE 04
The two outcomes a visit can end in: discharge or admission to hospital. Change the outcomes and Auto Layout reflows the branches with them.
Download the .pptx and drop it into your deck. Every shape is a native PowerPoint object, so you can edit it with PowerPoint's own tools — and with Lucen Flowchart installed, connectors reroute and the diagram reflows as you move things.
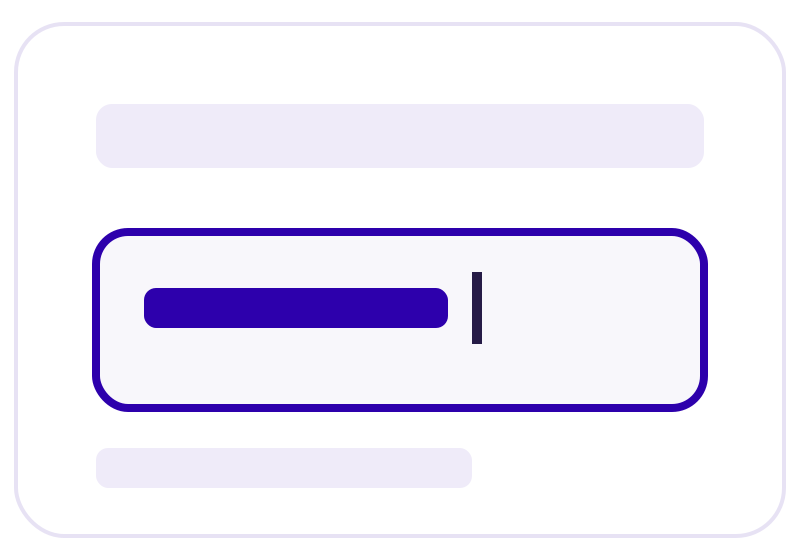
Click any step and type to replace the text. Font, fill, and size follow your deck theme.
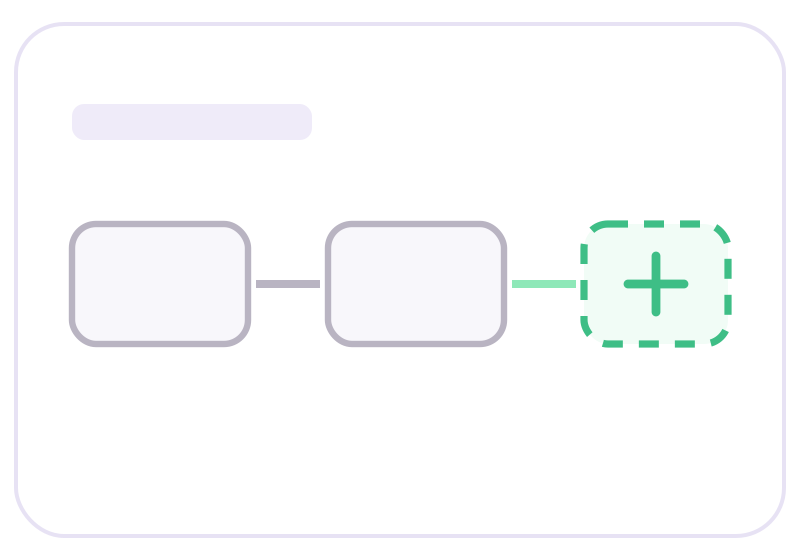
Copy a shape into the flow, or delete one you don't need.
Change the deck theme and the flowchart follows. Override individual shape colors when a step or lane needs to stand out.
Teams use it as the process of record for ED operations, a stakeholder slide in a capacity or quality improvement review, a training reference for new clinical and administrative staff, and a starting point for any patient pathway — outpatient clinics, day surgery, or discharge planning.
If your process differs from the template, describe it instead of redrawing it. Lucen AI generates the diagram as native, editable shapes on the current slide, then keeps editing it in place rather than regenerating from scratch.
1. Open Lucen AI with Generate with AI — On the Lucen Flowchart tab, choose Generate with AI. The Lucen AI pane opens beside the slide — describe the change you need, or attach an image of a diagram you already have.
2. Answer the clarifying questions — If the prompt is broad, Lucen AI asks about the audience and depth before generating.
3. Refine it on the slide — Ask for a sub-swimlane or a new branch, or edit the shapes directly. The diagram stays the same object throughout.
If your process already exists as a screenshot or a photo of a whiteboard, give the image to Lucen AI instead of redrawing it. It reads the steps, decisions, and any lanes, then rebuilds the same flowchart on your slide as native PowerPoint shapes, which you then edit like any other object — rename a step, add a branch, or ask for another lane.
A patient pathway works best as a swimlane, because a visit is a series of handovers between teams rather than one continuous activity. We recommend following this process:
This template documents an operational pathway, not clinical guidance. Local protocols always take precedence.
Each lane groups the steps that belong together:
Add a lane for nursing, radiology, laboratory, or a specialty consult if your pathway needs it. Add layout inserts it, and the diagram reflows around it.
Acuity is a rating of how urgently a patient needs to be seen, assigned at triage and used to sequence care rather than to diagnose. Most emergency departments use a five-level scale, with level one being immediately life-threatening and level five being non-urgent.
Widely used systems include the Emergency Severity Index in the United States, the Canadian Triage and Acuity Scale, and the Manchester Triage System in the UK and Europe. Which scale applies, and how it is scored, is set by local protocol.
Disposition is the decision about where the patient goes when their emergency care ends. In this template, it resolves to two outcomes: discharge or admission, because those are the two that account for most visits.
Real departments often need more: transfer to another facility, observation, leaving against medical advice, or death in the department. Add them as further exits from the same decision node if your pathway records them.
Because the question is not a yes or no question. Yes and no only work when a decision has two opposed answers; disposition has two parallel outcomes, and labelling them yes and no would force an arbitrary choice about which one counts as yes.
Naming the exits after the outcomes makes the diagram readable without a legend, and it makes adding a third outcome straightforward rather than structurally awkward.
Almost always at the handovers rather than inside the steps. The common ones:
Mapping the pathway does not remove those delays, but it does make them attributable, which is the first step in a capacity conversation.
Patient flow describes how a person moves through a department: the operational sequence of steps, handovers, and waits. A clinical pathway describes how a specific condition should be treated.
The difference matters in practice: patient flow is owned by operations and applies to every visit, while a clinical pathway is owned clinically and applies to one presentation. This template maps the first.
Every lane should have a named owner, and the handovers between them are where visits stall:
The download is a free .pptx made of native PowerPoint shapes, so anyone can open, read, and edit it, and you can share it as you would any deck; recipients need nothing installed.
The smart connectors, Auto Layout, and Lucen AI come from the Lucen Flowchart add-in, which adds a Lucen Flowchart tab to the ribbon and runs on Windows with PowerPoint 2016 or later and with PowerPoint for Microsoft 365. PowerPoint for the web, Mac, and mobile are not supported. Setup and troubleshooting steps are in Lucen Support.
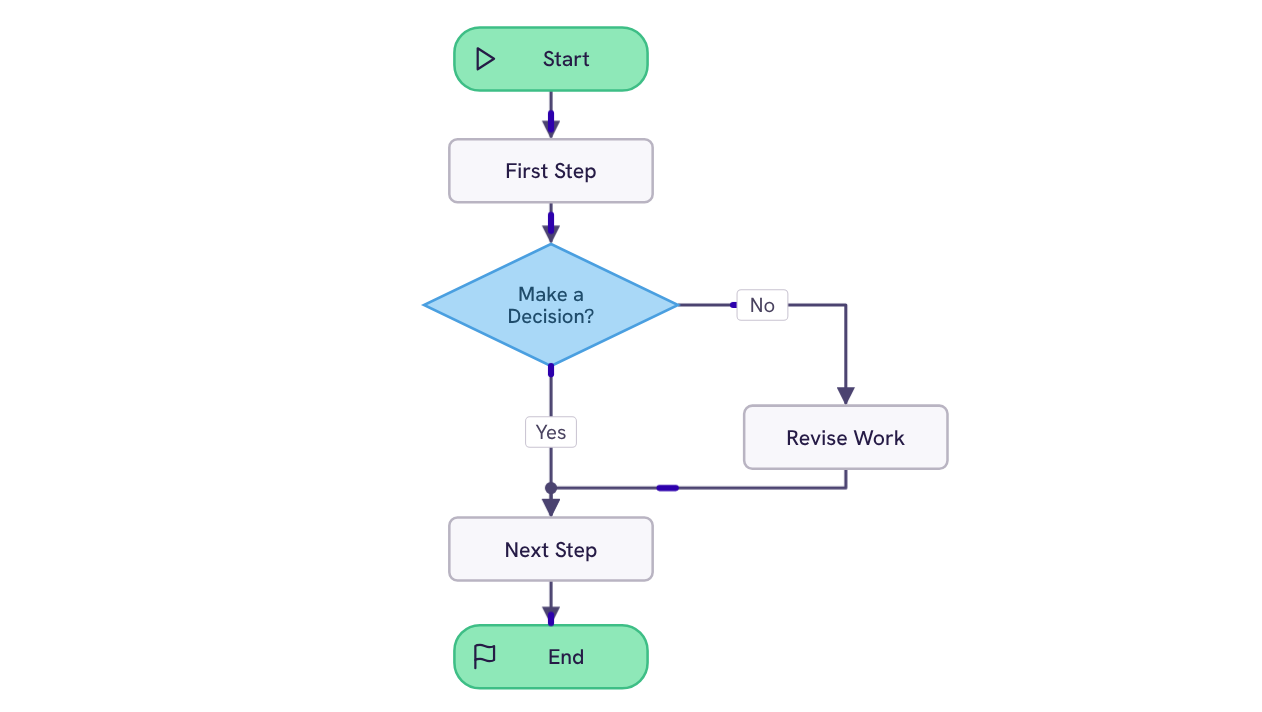
Five shapes and one decision branch: A start, two steps, a revision path, and an end. The fastest way to map a process you have not drawn before.
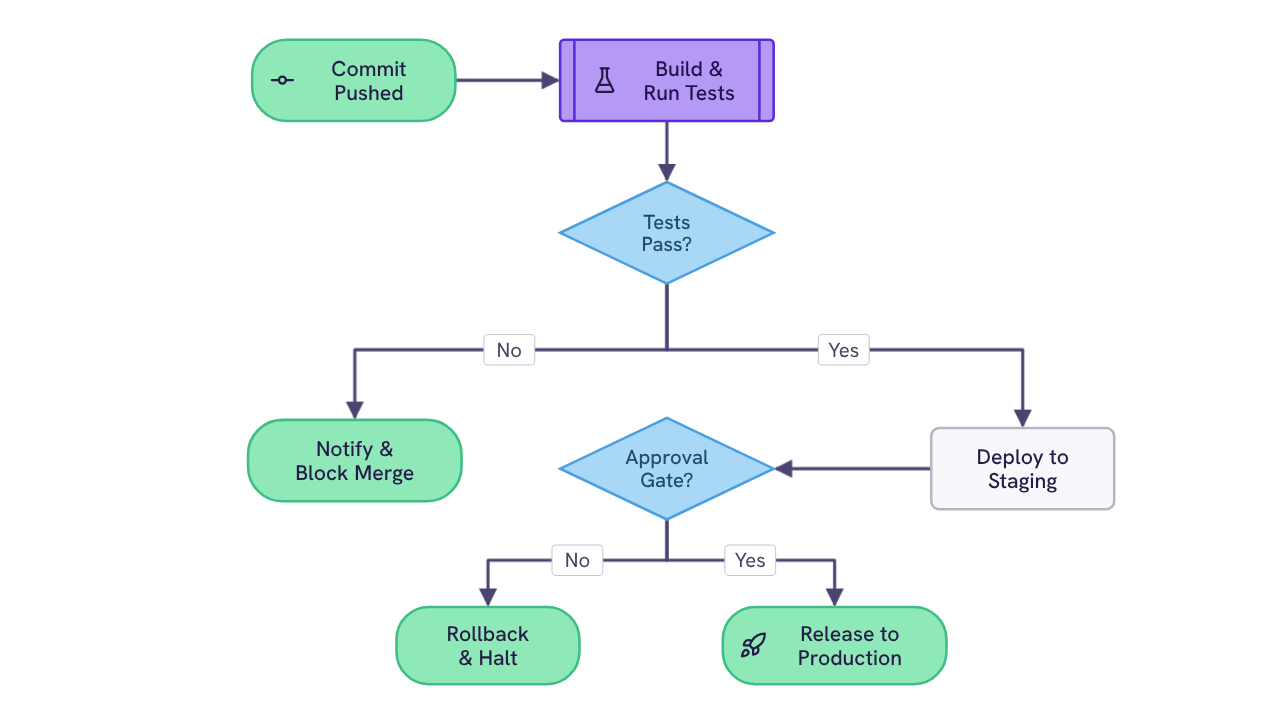
Two gates: automated tests and a human approval. Routing every commit to production, a blocked merge, or a rollback.
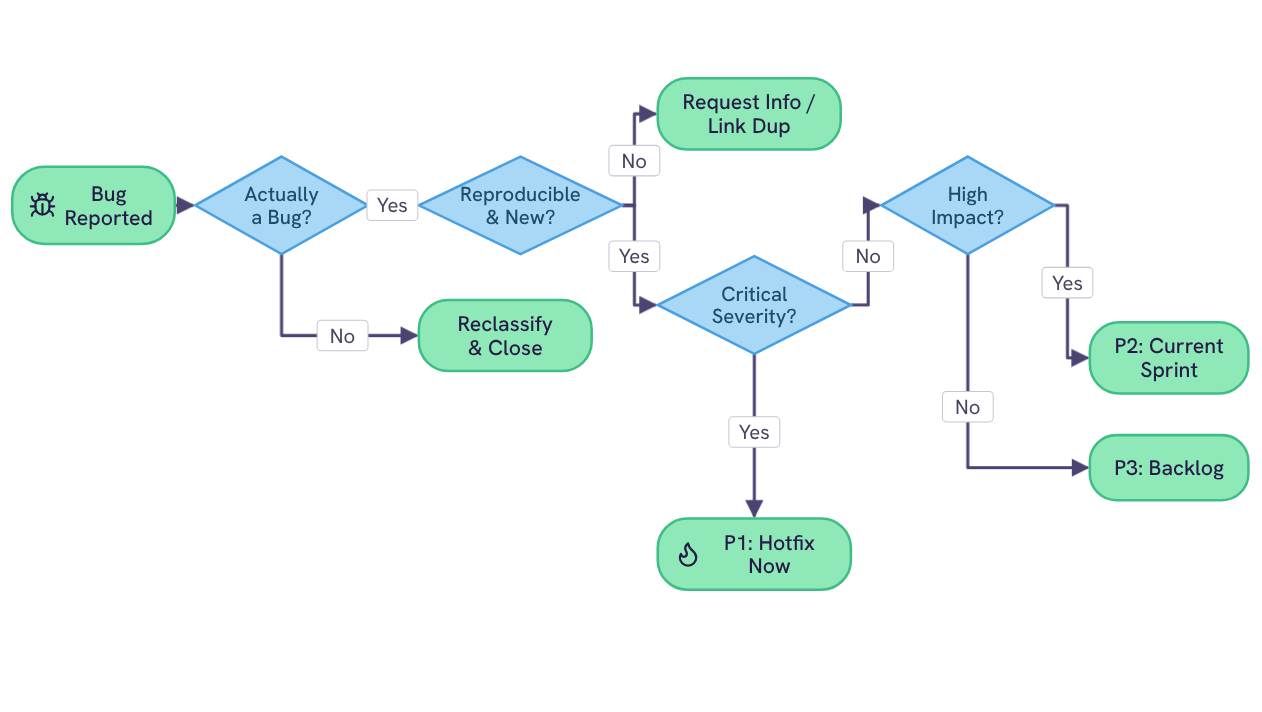
Four decision points: validity, reproducibility, severity, and impact. Routing every reported bug to one of five outcomes, from hotfix now to backlog.
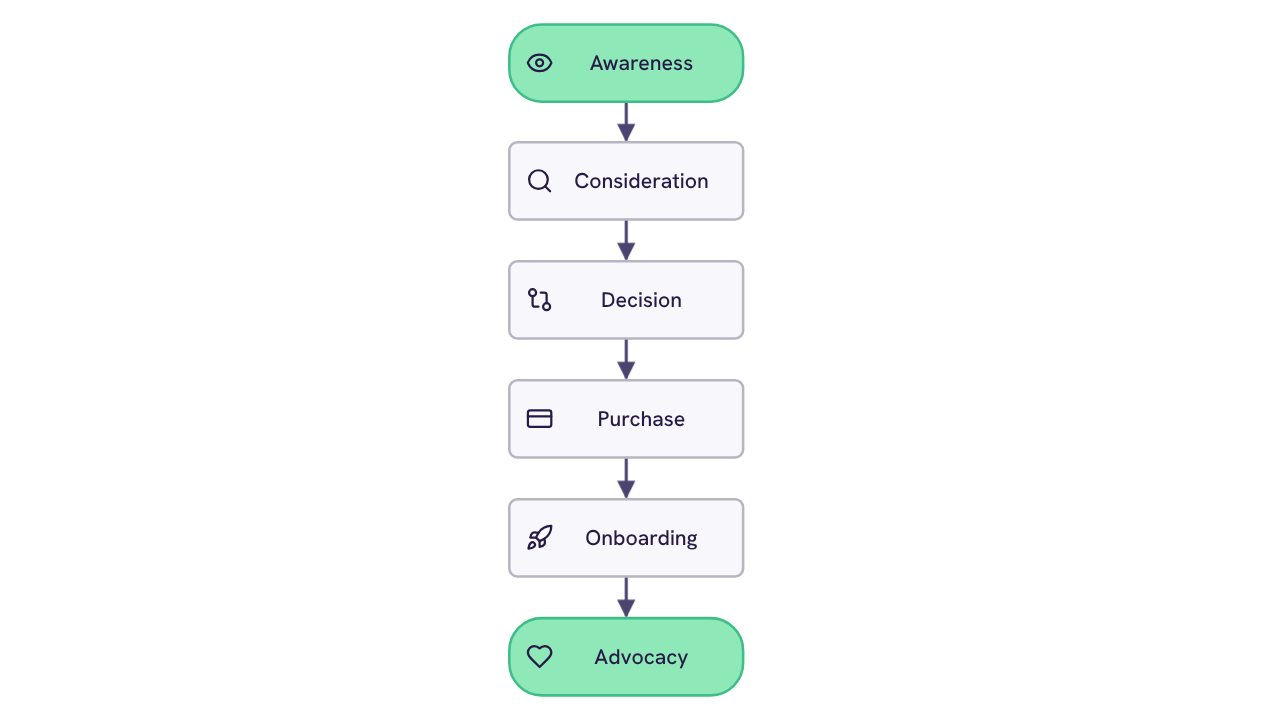
Six stages: awareness, consideration, decision, purchase, onboarding, and advocacy. Laid out as a linear lifecycle with a milestone icon at every step.
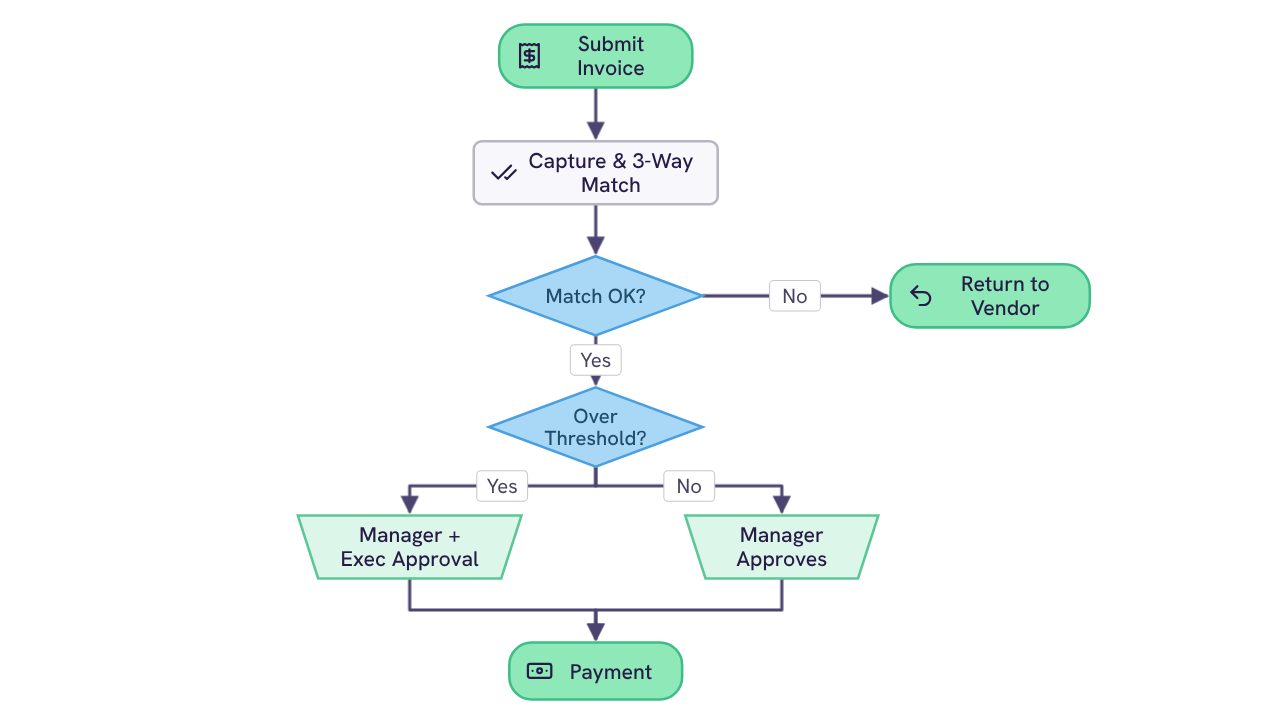
Two decision points: the three-way match and the value threshold. Routing an invoice from submission through the right level of approval to payment, or back to the vendor.
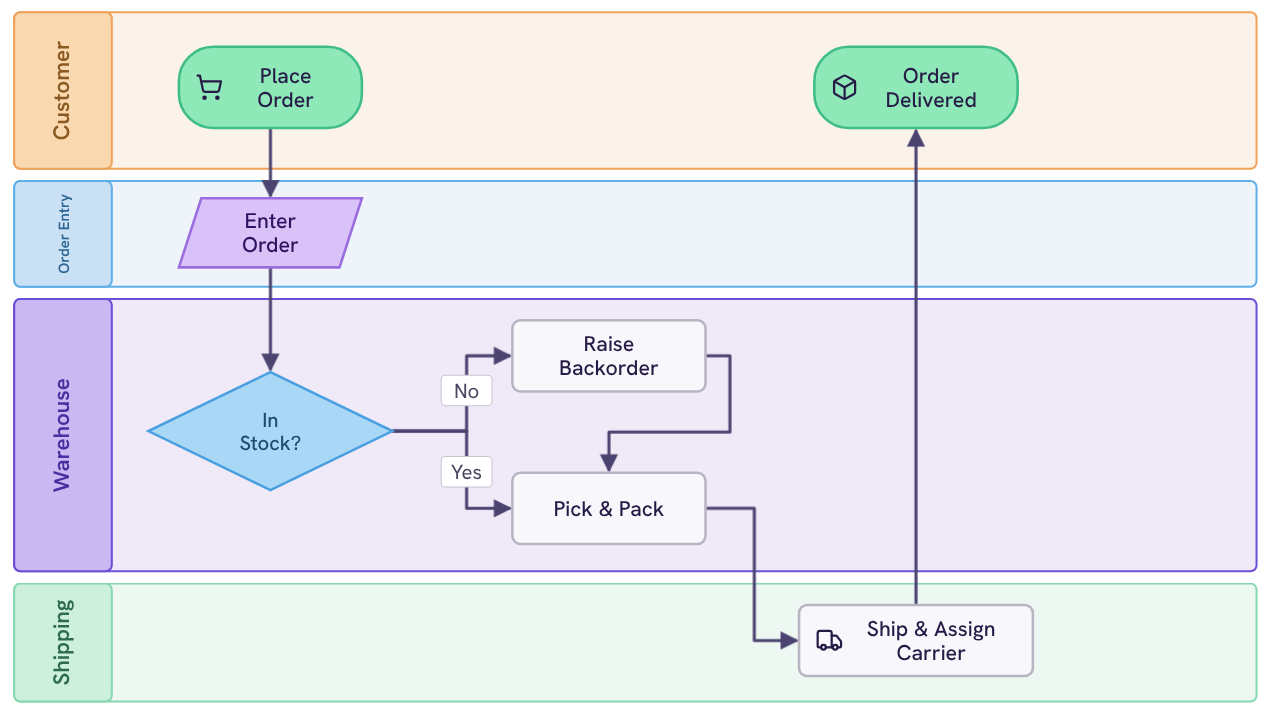
Four lanes: customer, order entry, warehouse, and shipping. Routing an order from placement through a stock check and picking to dispatch and confirmed delivery.
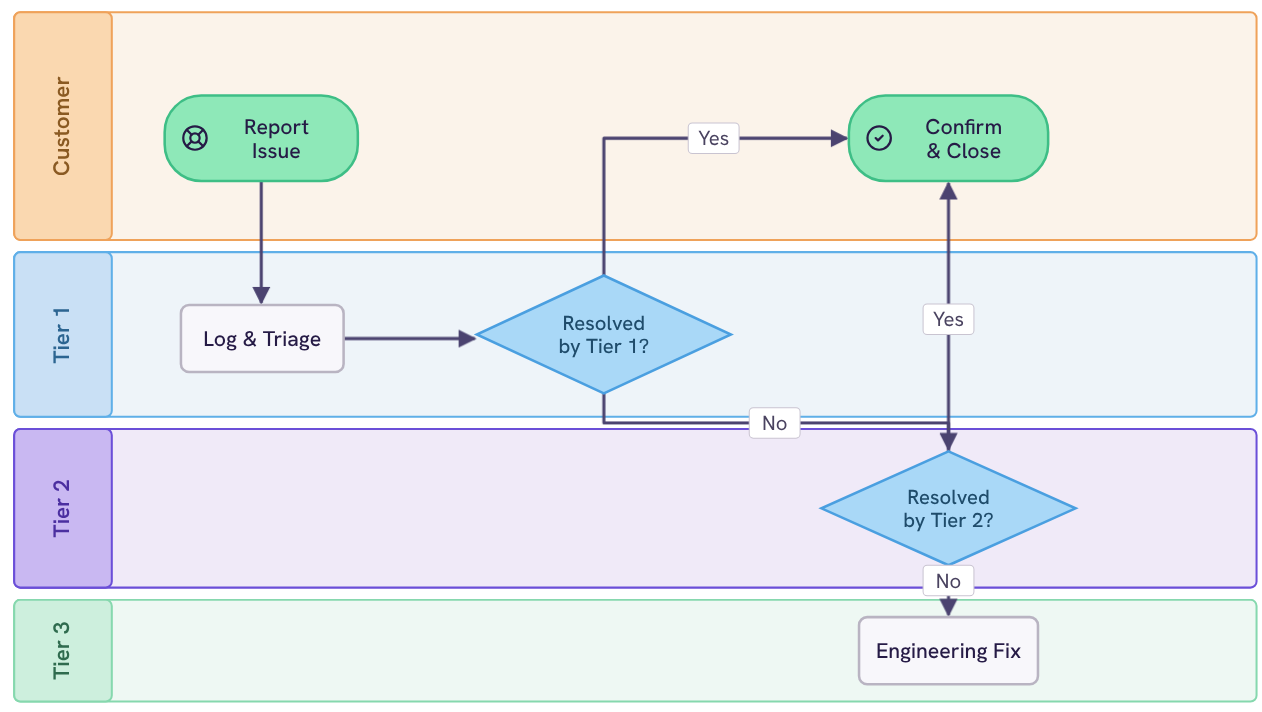
Four lanes: customer, Tier 1, Tier 2, and Tier 3. Routing an issue from first report through two resolution gates to engineering or a confirmed close.
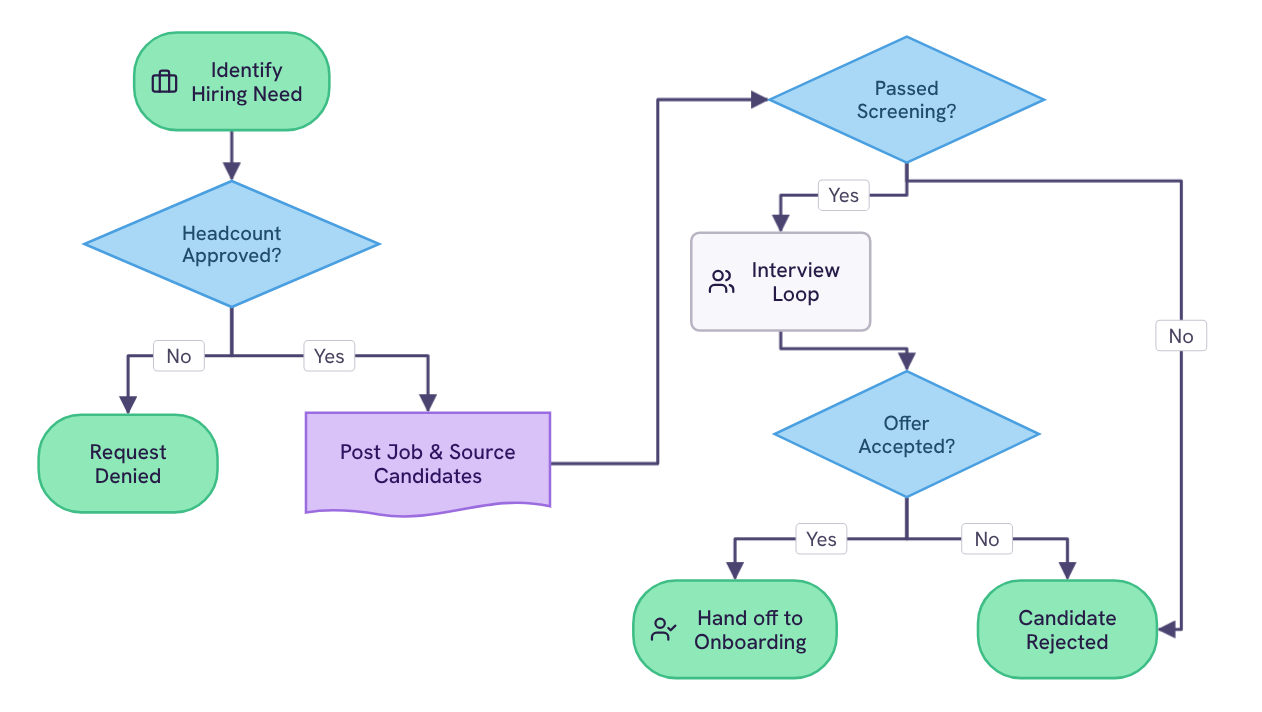
Three decision points: headcount approval, screening, and the offer. Routing a role from an identified need through sourcing and interviews to the onboarding handoff.
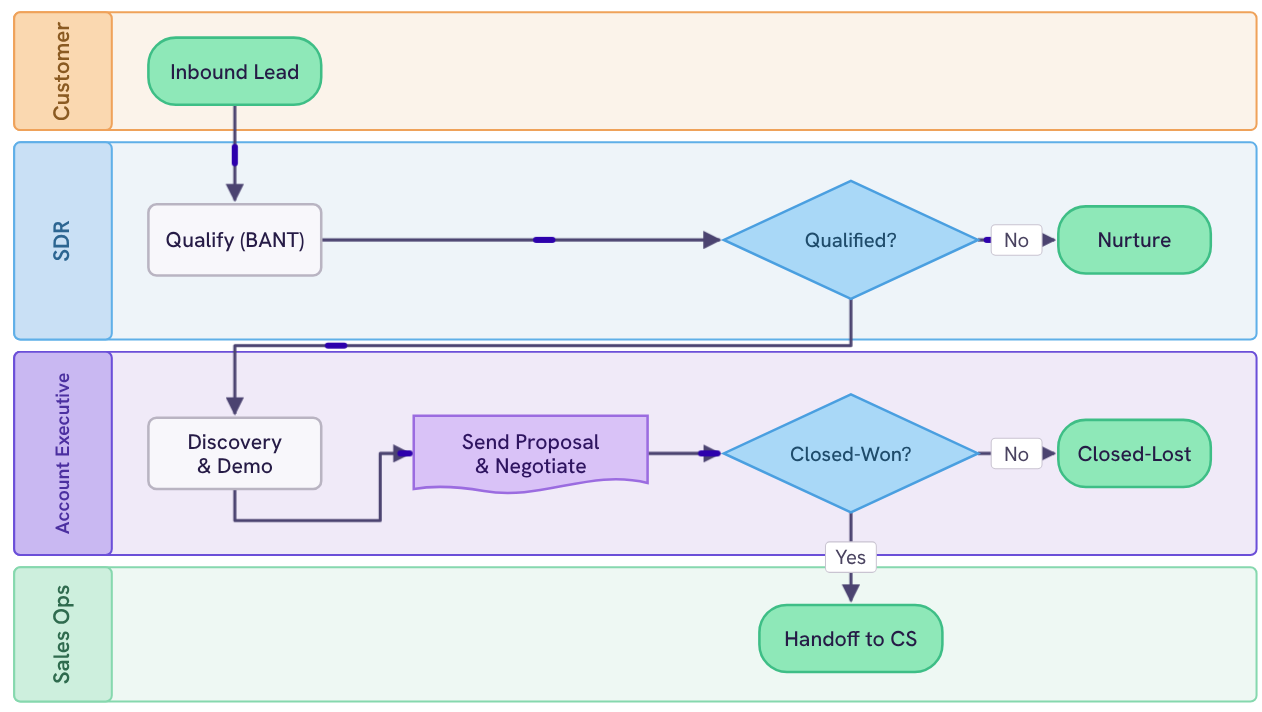
Four lanes: customer, SDR, account executive, and sales ops. Covering the inbound lead, BANT qualification, discovery, proposal, and the handoff to customer success.
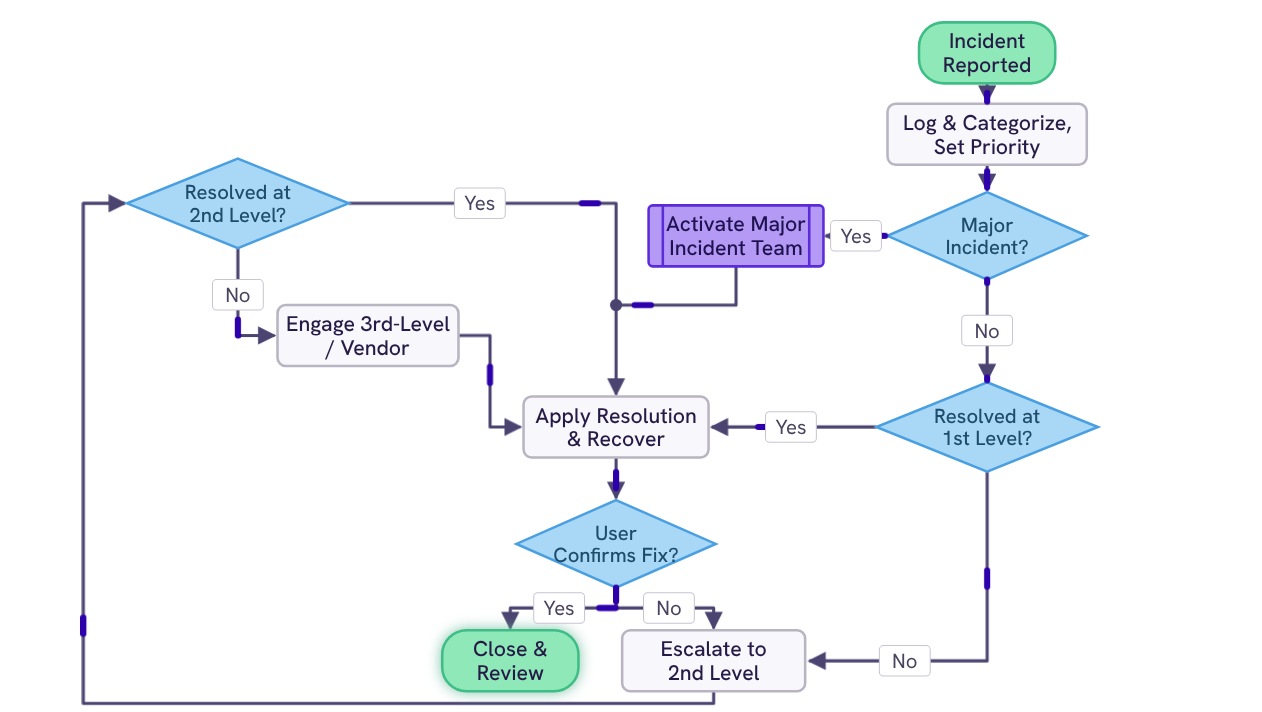
Four decision points: major incident, first level, second level, and user confirmation, routing an incident from first report through tiered escalation to close and review.
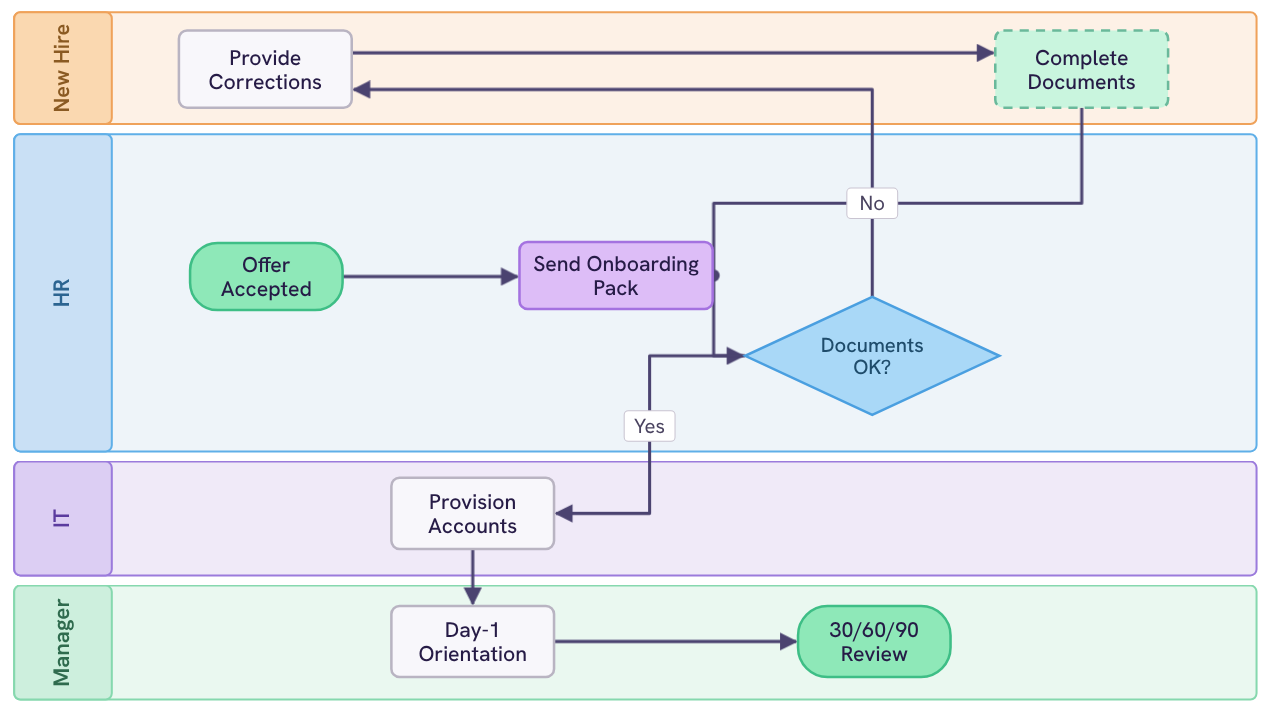
Four lanes — new hire, HR, IT, and manager — covering the offer, documents, provisioning, day-1 orientation, and the 30/60/90 review.

Free .pptx, editable in PowerPoint, no diagramming tool required.

Your download should start now. If it doesn’t start click here and check your inbox for tips to get started.