
Simple flowchart template
Five shapes and one decision branch: A start, two steps, a revision path, and an end. The fastest way to map a process you have not drawn before.



Four lanes: customer, Tier 1, Tier 2, and Tier 3. Routing an issue from first report through two resolution gates to engineering or a confirmed close.
Powered by Lucen Flowchart
A customer support escalation flowchart is a swimlane diagram that shows every step between a reported issue and a confirmed fix, with each lane assigned to the tier that owns it.

An issue is reported, and whether it takes one team or three depends on a decision made in the first ten minutes. The flowchart puts all four lanes in one frame: customer, Tier 1, Tier 2, and engineering so nobody has to ask where a ticket sits.
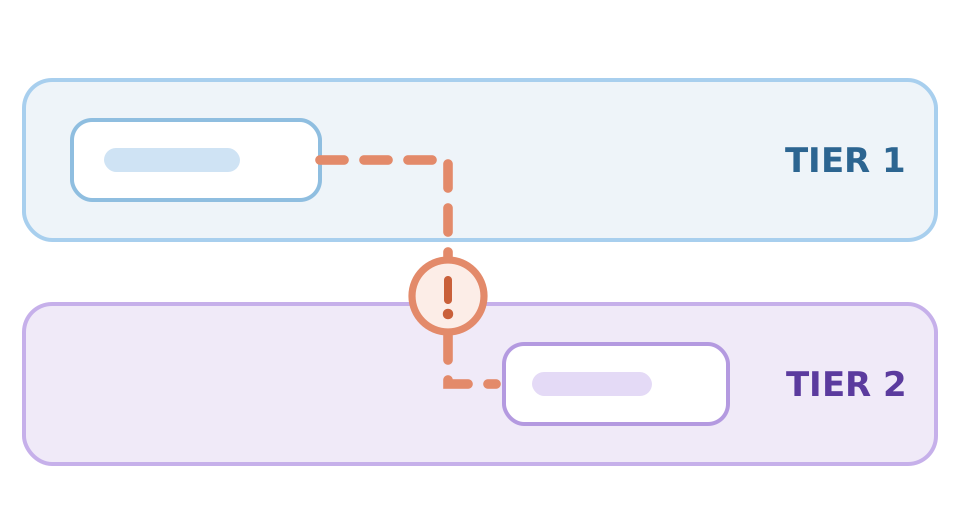
Individual fixes rarely fail, but handoffs do. A ticket sits at Tier 1 because nobody agreed when it should move, or it reaches engineering with no context attached. A swimlane makes those transitions explicit, so a stalled ticket is visible instead of assumed to be in progress.
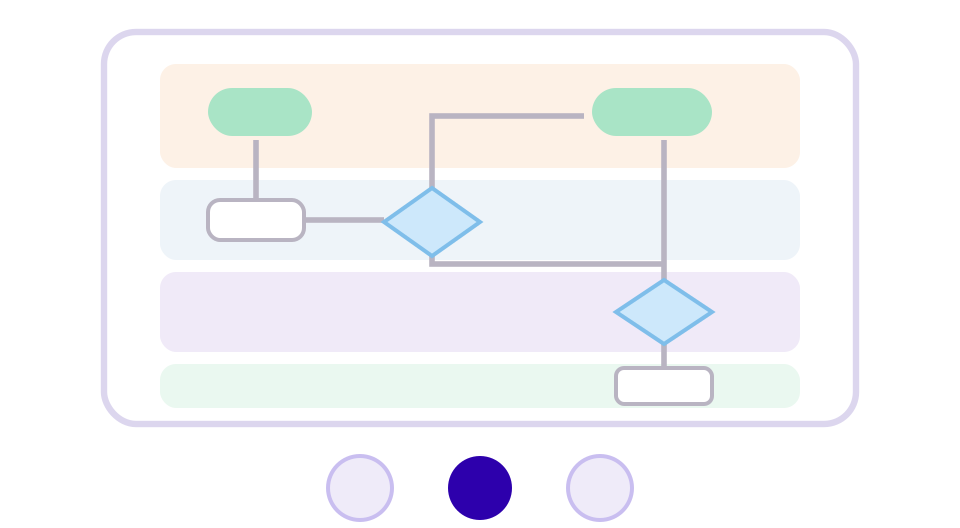
A diagram survives a service review in a way a ticket queue does not. That is why support and Ops teams keep the flowchart as the process of record rather than a slide decoration and why it belongs in the deck, not in the help desk tool.
Templates are grouped by the team that uses them. Open Sales & Customer, pick the customer support escalation flowchart, and it opens on a PowerPoint slide as native, editable shapes.
Four process shapes, two decision nodes, four labelled lanes, and the connectors that join them all native PowerPoint objects on a single 16:9 slide, built with Lucen Flowchart.
LANE 01
The reported issue that starts the process, and the confirmation that closes it. Both ends of the flow sit with the customer rather than with support.
LANE 02
Logging and triage, then the first resolution gate. Most tickets should end here, which is why this lane carries the only step before a decision is made.
LANE 03
The second resolution gate, for anything Tier 1 cannot close. A yes returns the ticket to the customer for confirmation; a no sends it on.
LANE 04
The engineering fix, for issues that need a code or infrastructure change rather than a support action. Change the owner and Auto Layout reflows the rest of the lane with it.
Download the .pptx and drop it into your deck. Every shape is a native PowerPoint object, so you can edit it with PowerPoint's own tools — and with Lucen Flowchart installed, connectors reroute and the diagram reflows as you move things.
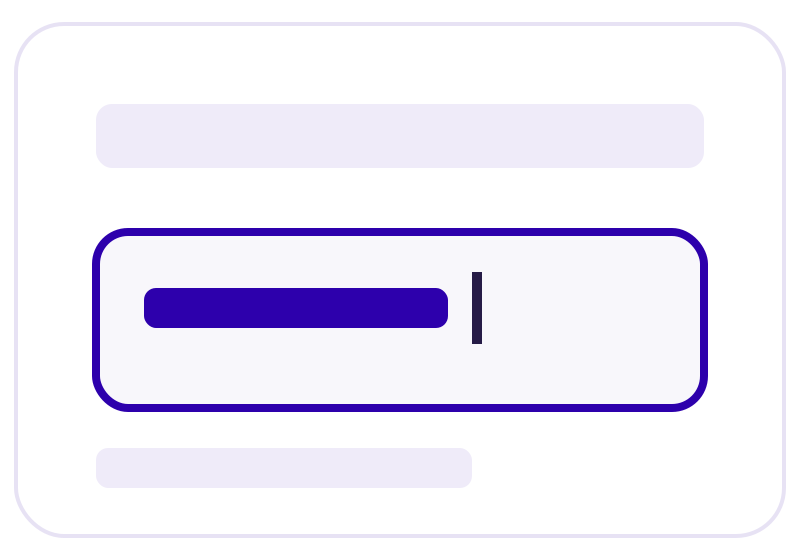
Click any step and type to replace the text. Font, fill, and size follow your deck theme.
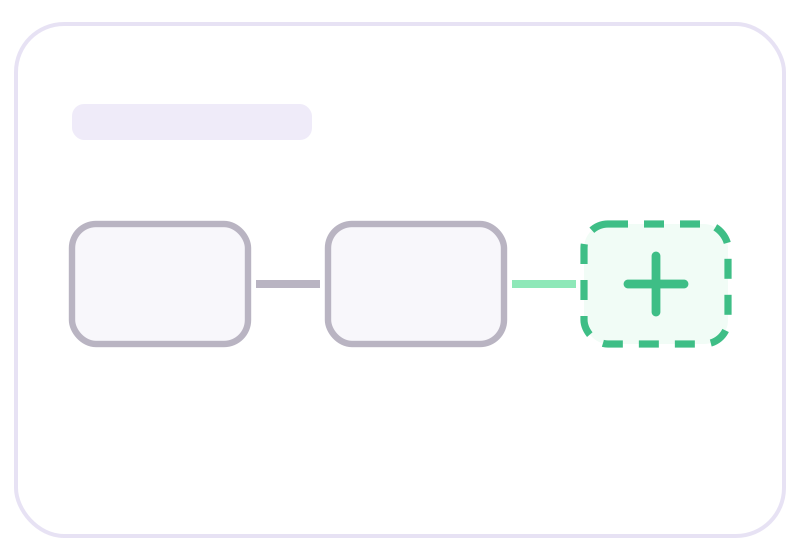
Copy a shape into the flow, or delete one you don't need.
Change the deck theme and the flowchart follows. Override individual shape colors when a step or lane needs to stand out.
Teams use it as the process of record for support ops, a stakeholder slide in a service review or QBR deck, a training reference for new agents, and a starting point for any tiered process — returns and refunds, warranty claims, or complaint handling.
If your process differs from the template, describe it instead of redrawing it. Lucen AI generates the diagram as native, editable shapes on the current slide, then keeps editing it in place rather than regenerating from scratch.
1. Open Lucen AI with Generate with AI — On the Lucen Flowchart tab, choose Generate with AI. The Lucen AI pane opens beside the slide — describe the change you need, or attach an image of a diagram you already have.
2. Answer the clarifying questions — If the prompt is broad, Lucen AI asks about the audience and depth before generating.
3. Refine it on the slide — Ask for a sub-swimlane or a new branch, or edit the shapes directly. The diagram stays the same object throughout.
If your process already exists as a screenshot or a photo of a whiteboard, give the image to Lucen AI instead of redrawing it. It reads the steps, decisions, and any lanes, then rebuilds the same flowchart on your slide as native PowerPoint shapes, which you then edit like any other object — rename a step, add a branch, or ask for another lane.
Support escalation works best as a swimlane, because a ticket is a series of handoffs between tiers rather than a single sequence of tasks. We recommend following this process:
Each lane is one owner, in the order they get involved:
Add a lane for a vendor, a field engineer, or a dedicated major-incident team if your process needs it. Add layout inserts it, and the diagram reflows around it.
Tiered support splits a support team by depth of expertise rather than by product. Tier 1 handles high-volume, known issues. Tier 2 handles technical diagnosis within the supported product. Tier 3 is engineering, reached only when the fix requires changing the product itself.
The point of the model is cost and speed: most tickets are resolved by the cheapest, fastest tier, and only the genuine exceptions consume engineering time.
The honest answer is that it depends on your definitions, and that is exactly why the threshold belongs on a diagram rather than in a rep's judgement. Most teams escalate when one of three things is true:
Edit the decision node text to match your own criteria; the branches stay attached as the diagram reflows.
Functional escalation moves a ticket sideways to a team with deeper expertise, which is what the two decision gates in this template do. Hierarchical escalation moves it upward to someone with more authority, usually because of business impact or an unhappy customer rather than technical difficulty.
They are different paths, and it is worth drawing both. Add a branch out of Tier 1 to a support manager if hierarchical escalation is part of your process.
Because a ticket closed by the agent and a problem solved for the customer are not always the same thing. Putting Confirm & Close in the customer lane makes the fix conditional on the person who reported it agreeing that it worked.
It also makes reopen rate meaningful. If confirmation is skipped, a reopened ticket looks like a new one, and the same failure gets counted as two successes.
PowerPoint can do it with SmartArt and the Shapes gallery, but the work is manual. You draw the lane bands yourself, place each shape, and reattach connectors every time something moves. For a flow that crosses four lanes and doubles back to the customer, this becomes the reason the diagram stops getting updated.
A faster route is the Lucen Flowchart tab, which adds the lanes from Add layout, snaps connectors to shape anchors, and reflows the diagram with Auto layout when you add a tier. Either way the result stays a set of native PowerPoint objects on your slide.
Every lane in the diagram should terminate at a named owner. A common split:
If a tier is escalating more than it resolves, the problem is usually the threshold rather than the team.
The download is a free .pptx made of native PowerPoint shapes, so anyone can open, read, and edit it, and you can share it as you would any deck; recipients need nothing installed.
The smart connectors, Auto Layout, and Lucen AI come from the Lucen Flowchart add-in, which adds a Lucen Flowchart tab to the ribbon and runs on Windows with PowerPoint 2016 or later and with PowerPoint for Microsoft 365. PowerPoint for the web, Mac, and mobile are not supported. Setup and troubleshooting steps are in Lucen Support.
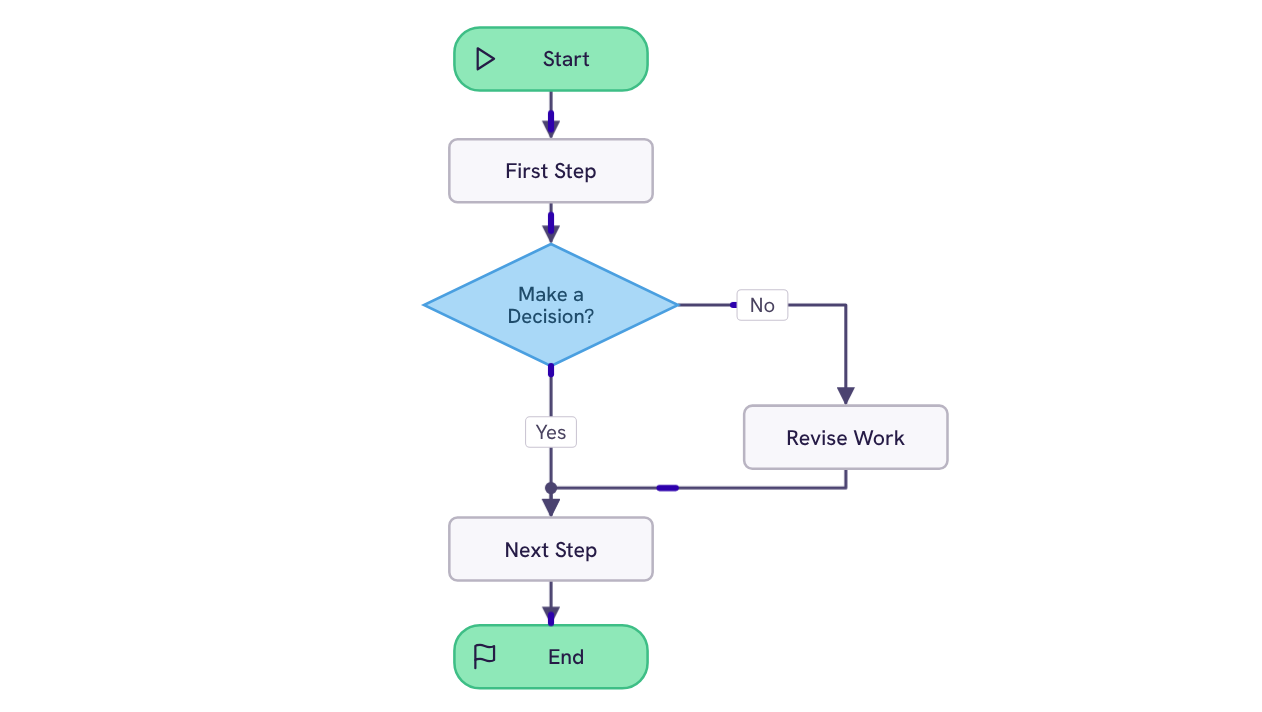
Five shapes and one decision branch: A start, two steps, a revision path, and an end. The fastest way to map a process you have not drawn before.
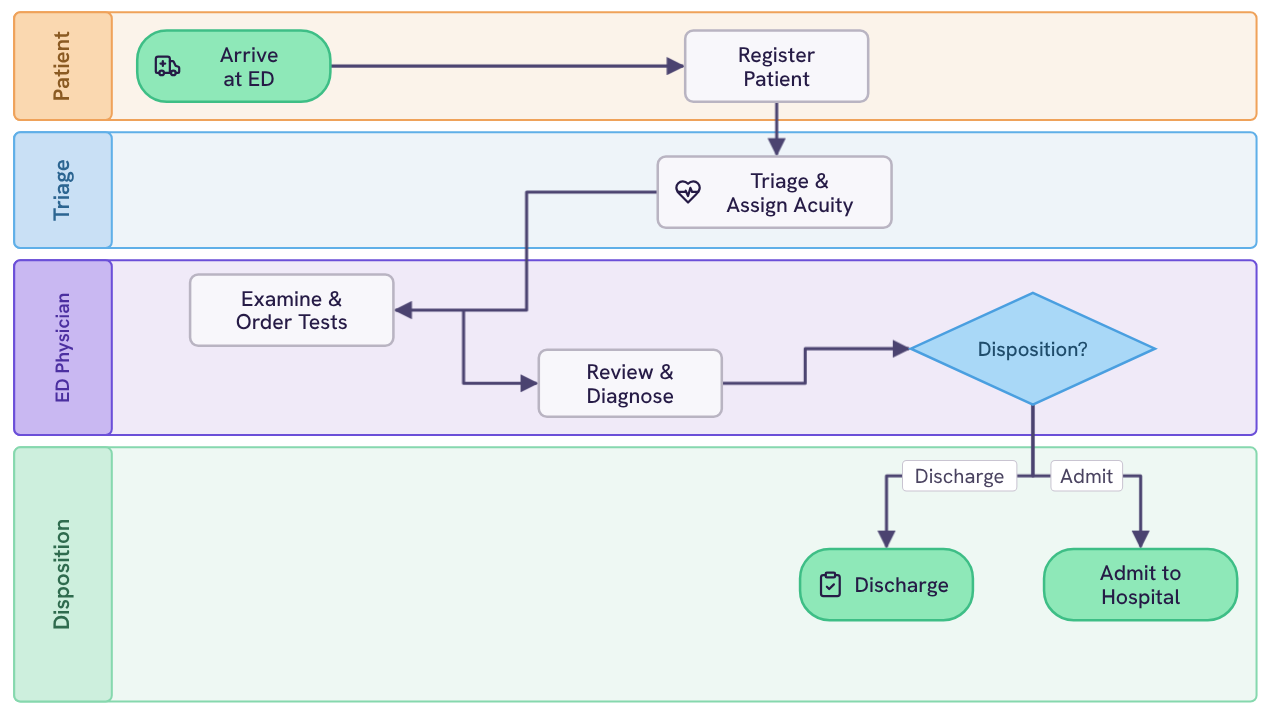
Four lanes: patient, triage, ED physician, and disposition. Routing a visit from arrival through acuity assessment and examination to admission or discharge.
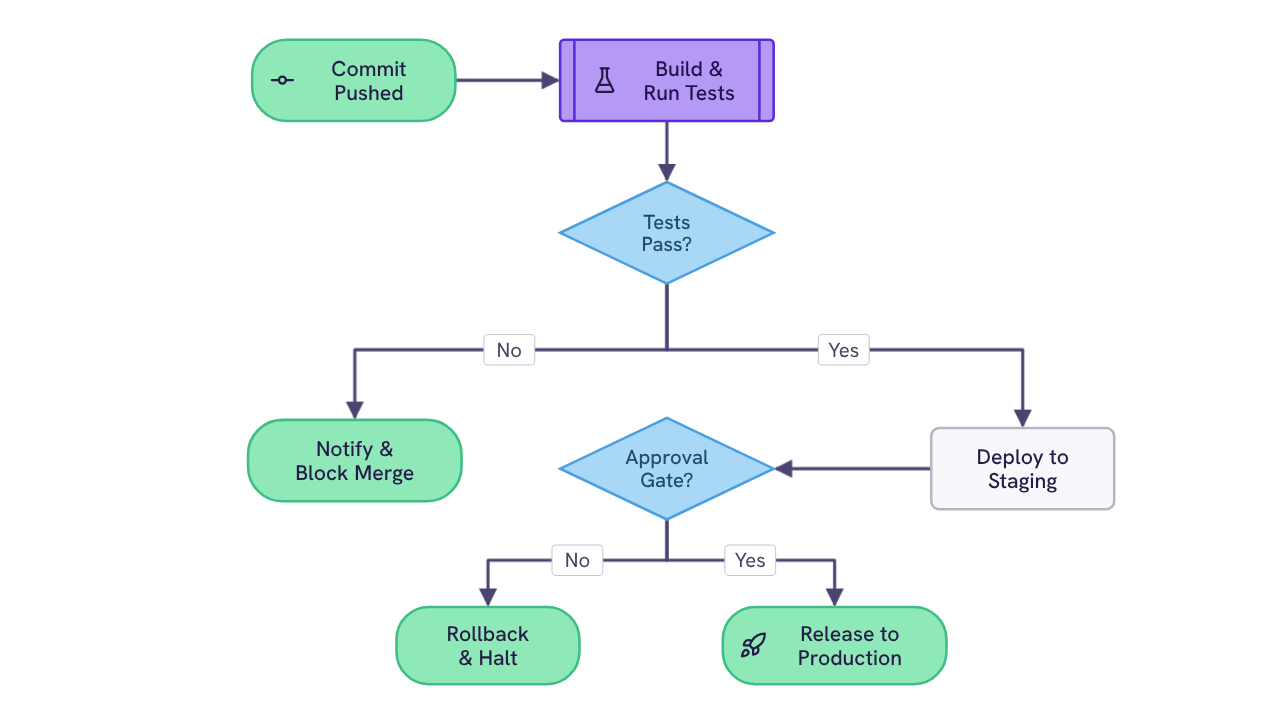
Two gates: automated tests and a human approval. Routing every commit to production, a blocked merge, or a rollback.
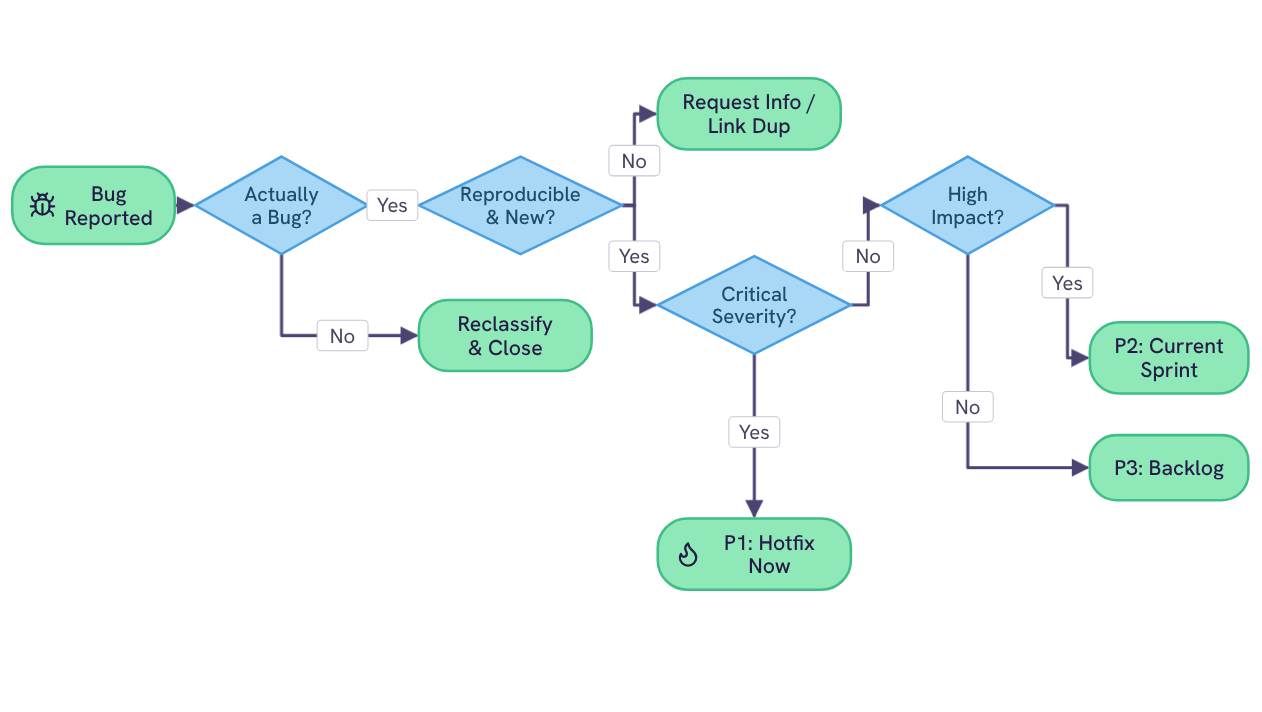
Four decision points: validity, reproducibility, severity, and impact. Routing every reported bug to one of five outcomes, from hotfix now to backlog.
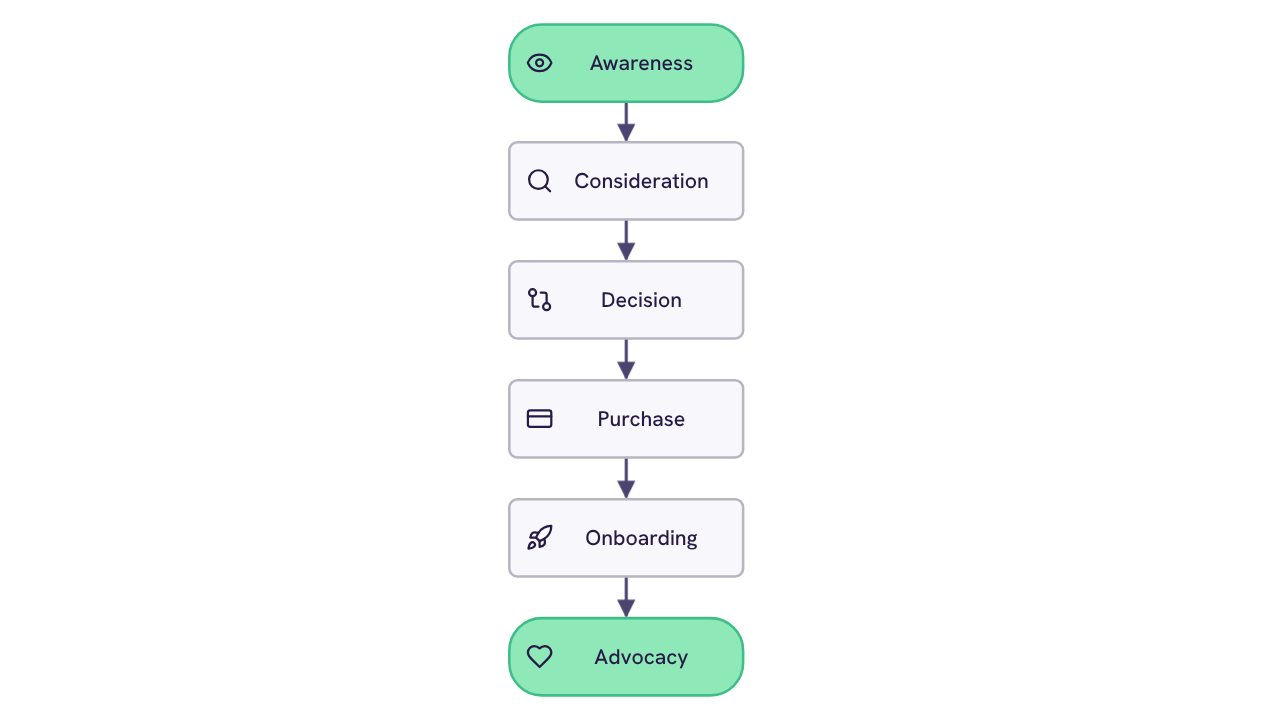
Six stages: awareness, consideration, decision, purchase, onboarding, and advocacy. Laid out as a linear lifecycle with a milestone icon at every step.
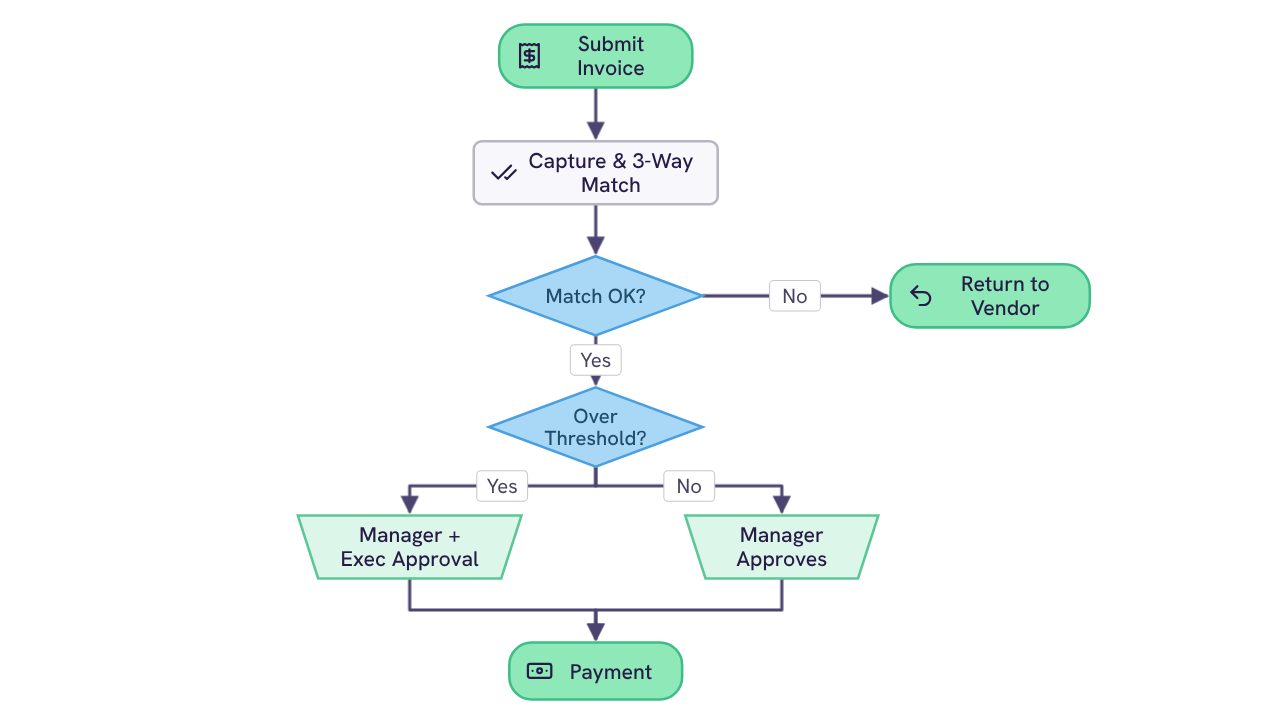
Two decision points: the three-way match and the value threshold. Routing an invoice from submission through the right level of approval to payment, or back to the vendor.
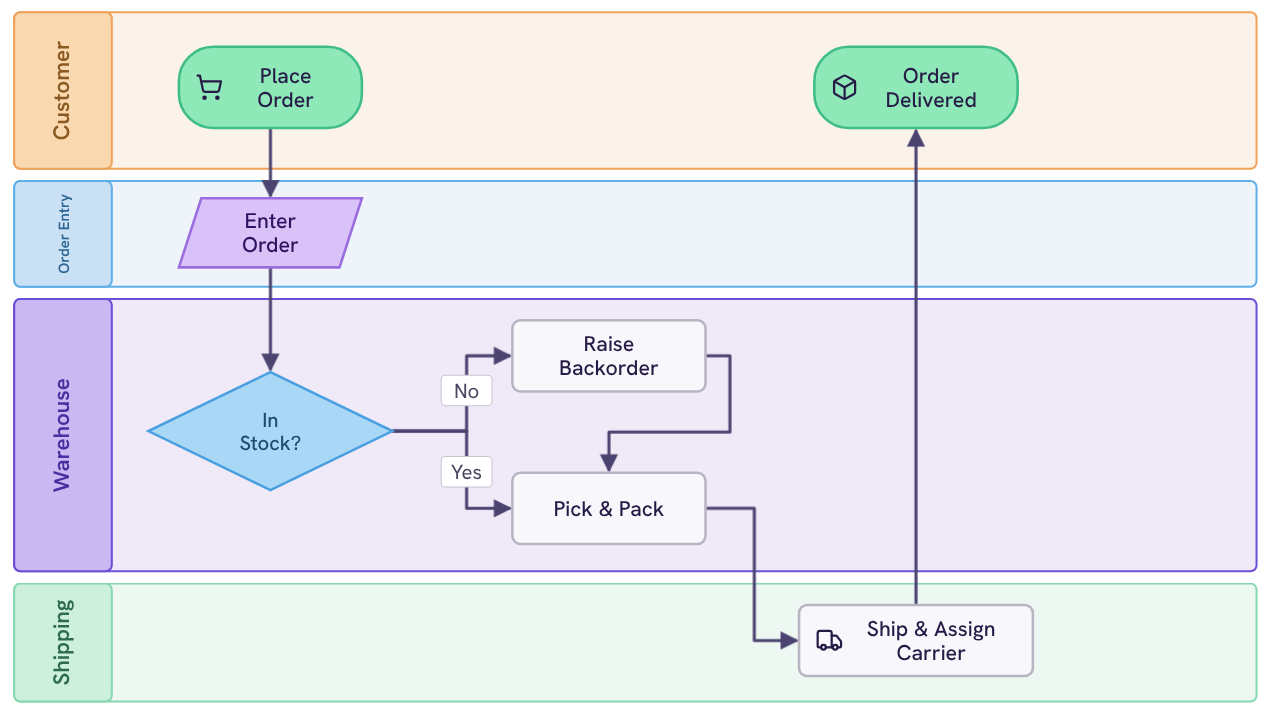
Four lanes: customer, order entry, warehouse, and shipping. Routing an order from placement through a stock check and picking to dispatch and confirmed delivery.
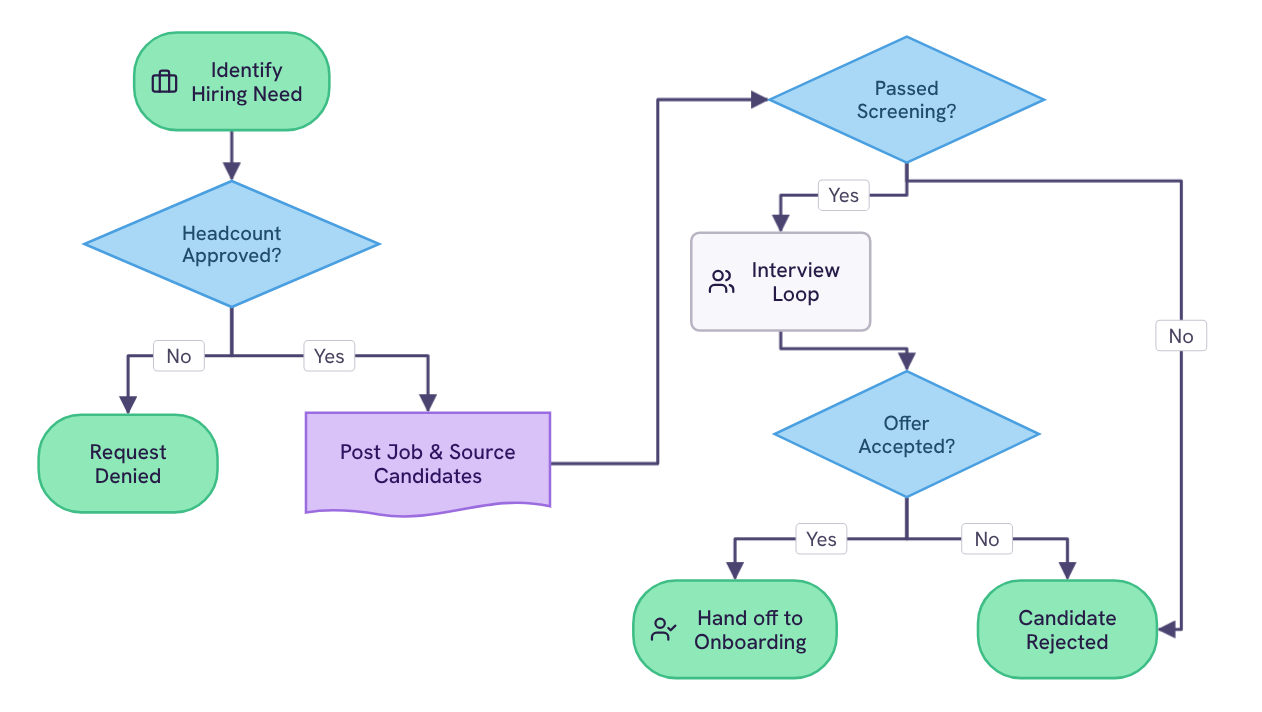
Three decision points: headcount approval, screening, and the offer. Routing a role from an identified need through sourcing and interviews to the onboarding handoff.
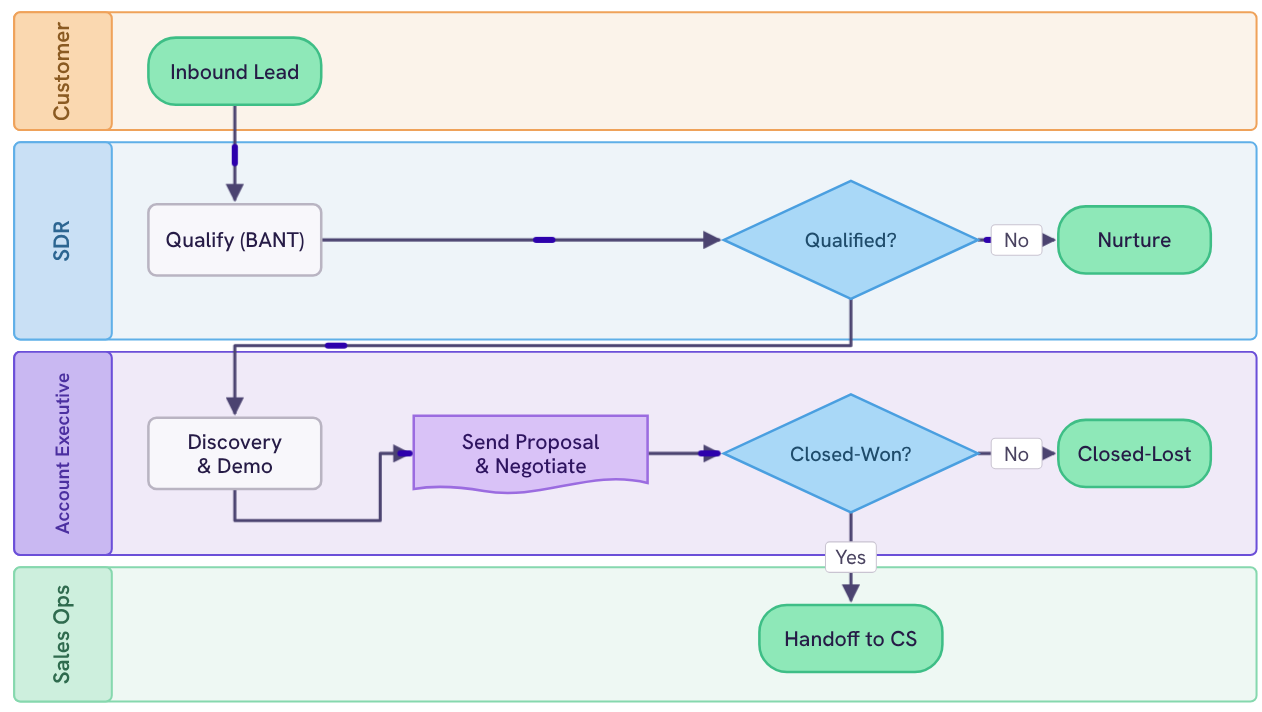
Four lanes: customer, SDR, account executive, and sales ops. Covering the inbound lead, BANT qualification, discovery, proposal, and the handoff to customer success.
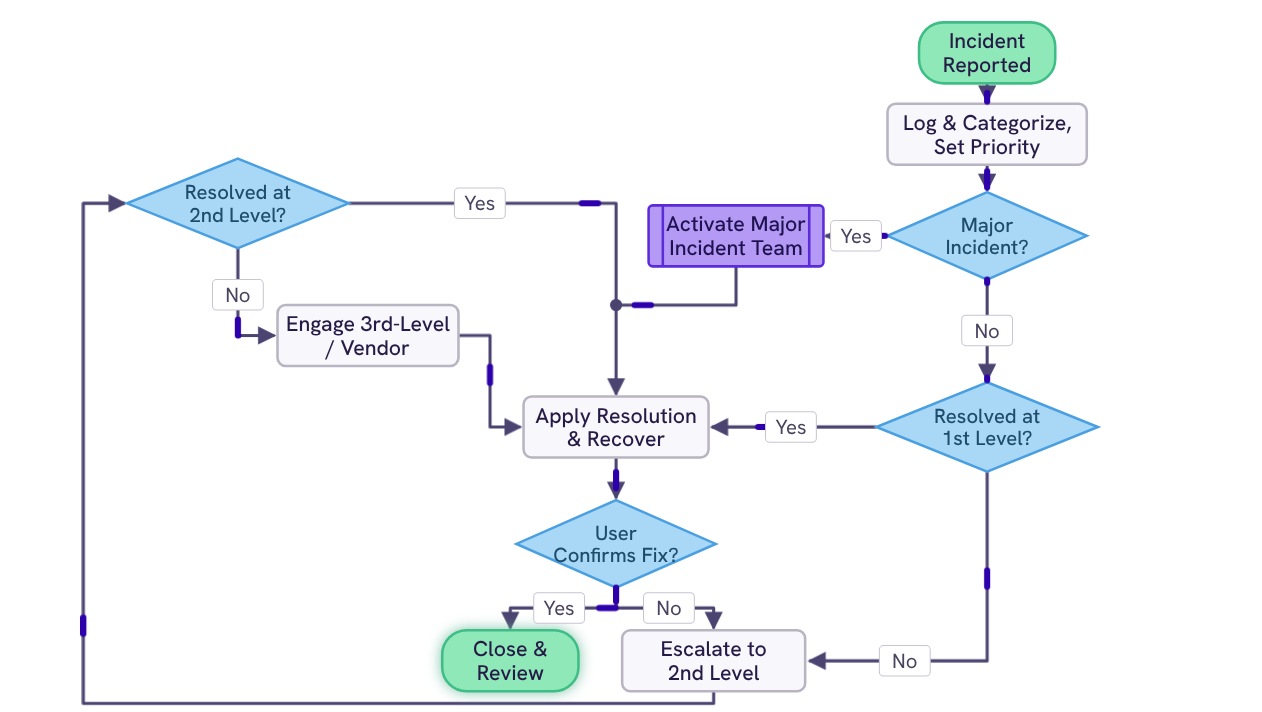
Four decision points: major incident, first level, second level, and user confirmation, routing an incident from first report through tiered escalation to close and review.
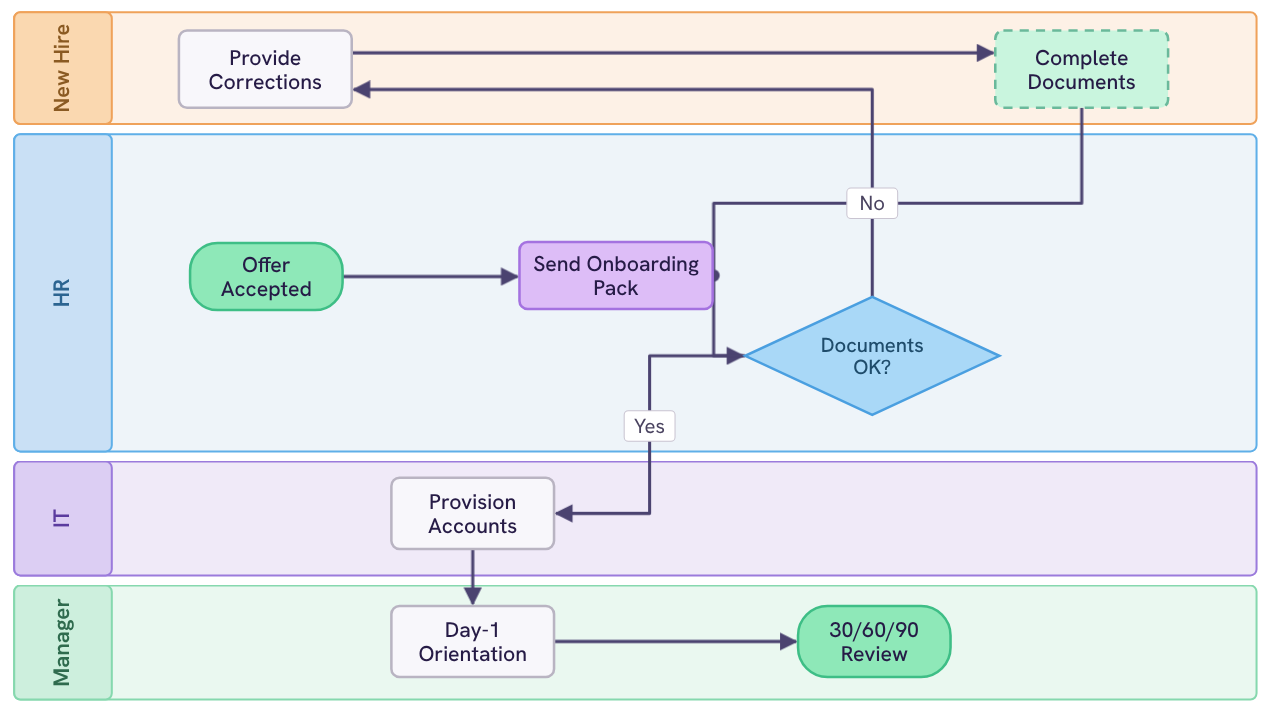
Four lanes — new hire, HR, IT, and manager — covering the offer, documents, provisioning, day-1 orientation, and the 30/60/90 review.

Free .pptx, editable in PowerPoint, no diagramming tool required.

Your download should start now. If it doesn’t start click here and check your inbox for tips to get started.